")
Back to Journals » Clinical Epidemiology » Volume 7
A simplified approach to the pooled analysis of calibration of clinical prediction rules for systematic reviews of validation studies
Authors Dimitrov B, Motterlini N, Fahey T
Received 13 May 2014
Accepted for publication 2 September 2014
Published 16 April 2015 Volume 2015:7 Pages 267—280
DOI https://doi.org/10.2147/CLEP.S67632
Checked for plagiarism Yes
Review by Single anonymous peer review
Peer reviewer comments 3
Editor who approved publication: Professor Vera Ehrenstein
Borislav D Dimitrov,1,2 Nicola Motterlini,2,† Tom Fahey2
1Academic Unit of Primary Care and Population Sciences, University of Southampton, Southampton, United Kingdom; 2HRB Centre for Primary Care Research, Department of General Medicine, Division of Population Health Sciences, Royal College of Surgeons in Ireland, Dublin, Ireland
†Nicola Motterlini passed away on November 11, 2012
Objective: Estimating calibration performance of clinical prediction rules (CPRs) in systematic reviews of validation studies is not possible when predicted values are neither published nor accessible or sufficient or no individual participant or patient data are available. Our aims were to describe a simplified approach for outcomes prediction and calibration assessment and evaluate its functionality and validity.
Study design and methods: Methodological study of systematic reviews of validation studies of CPRs: a) ABCD2 rule for prediction of 7 day stroke; and b) CRB-65 rule for prediction of 30 day mortality. Predicted outcomes in a sample validation study were computed by CPR distribution patterns (“derivation model”). As confirmation, a logistic regression model (with derivation study coefficients) was applied to CPR-based dummy variables in the validation study. Meta-analysis of validation studies provided pooled estimates of “predicted:observed” risk ratios (RRs), 95% confidence intervals (CIs), and indexes of heterogeneity (I2) on forest plots (fixed and random effects models), with and without adjustment of intercepts. The above approach was also applied to the CRB-65 rule.
Results: Our simplified method, applied to ABCD2 rule in three risk strata (low, 0–3; intermediate, 4–5; high, 6–7 points), indicated that predictions are identical to those computed by univariate, CPR-based logistic regression model. Discrimination was good (c-statistics =0.61–0.82), however, calibration in some studies was low. In such cases with miscalibration, the under-prediction (RRs =0.73–0.91, 95% CIs 0.41–1.48) could be further corrected by intercept adjustment to account for incidence differences. An improvement of both heterogeneities and P-values (Hosmer-Lemeshow goodness-of-fit test) was observed. Better calibration and improved pooled RRs (0.90–1.06), with narrower 95% CIs (0.57–1.41) were achieved.
Conclusion: Our results have an immediate clinical implication in situations when predicted outcomes in CPR validation studies are lacking or deficient by describing how such predictions can be obtained by everyone using the derivation study alone, without any need for highly specialized knowledge or sophisticated statistics.
Keywords: clinical prediction rules, derivation, validation, meta-analysis, primary care
Background
What is new?
A new, simplified method for computation of predicted number of outcomes in validation studies of clinical prediction rules (CPRs), for assessment of calibration performance in systematic reviews, is described. Our approach employs the frequency distribution pattern of the outcome in the derivation study (so called “derivation model”). Two CPRs (ABCD2 and CRB-65) are used as examples.
The new approach is tested and further confirmed in terms of functionality and validity. We created dummy variables and applied univariate, CPR-based logistic regression (LR) model and its coefficients from the derivation study to a sample validation study thus producing virtually identical predicted values as obtained by our new method.
Predicted values from the validation studies are computed and pooled estimates of “predicted:observed” risk ratios (RRs) with their 95% confidence intervals (CIs) are obtained for the first time in a meta-analysis by using a “derivation model”. Beyond discrimination assessment, as part of the overall predictive performance, forest plots are used to illustrate how our new method contributes to the evaluation of calibration and how the latter may vary across different strata of risk or population sub-groups.
The implication is that, when predicted outcomes in validation studies are neither published nor accessible or sufficient or no individual patient data (IPD) are available, such predicted values can be easily obtained by our simplified method. Our new approach describes and justifies how this can be achieved by everyone, when using data from a derivation study alone, without any further requirements for highly specialized knowledge or sophisticated statistical software.
Introduction to CPRs
CPRs are recognized as important tools for optimization of diagnostic processes, management, and treatment, especially in primary care. Known by various terms, “risk score”, “scorecard”, “algorithm”, and “guide”, CPRs are clinical techniques that quantify the contribution of a patient’s history, physical examination, and diagnostic tests to stratify patients and predict probability for a specific disorder or outcome (diagnosis, prognosis, referral, treatment). Although not designed to replace clinical knowledge or experience, CPRs offer additional, “smart” ways to assist doctors and providers in the diagnostic and prognostic processes.1
Phases of CPRs, derivation, and validation
Three obligatory phases exist in CPR development before it can be implemented in clinical practice: derivation, validation (narrow and broad), and clinical impact analysis (Figure A1.1 in the Supplementary materials).2,3 While the narrow validation can be either internal or external in the view of the derivation sample, the broad validation can be only an external one. Certain methodological standards are followed for CPR development and validation.4 At present, most CPRs are at the stage of initial development (derivation, mainly), fewer are validated and even less still were subject to impact analysis.
The derivation of CPRs is usually based on multivariable regression modeling by assessing a continuous outcome or the presence/absence of the target disorder and enabling the CPR development according to different sources of diagnostic or prognostic information.5 The resulting model may stratify patients into subgroups (low, intermediate or high risk) or compute predicted probabilities for the outcome. These probabilities serve to estimate, using a cut-off, the presence or absence of the outcome. CPRs can be based on and/or presented as equations with exact regression coefficients or as a more user-friendly, linear format like a simple score.6,7 Ideally, CPRs should be based on a small number of variables – in practice, few variables with strong effects usually explain most of the variance and account for most of the prognostic power. Although some loss of prognostic power is inevitable, the simplified rules often perform equally well compared to the more complex models. Once the CPR is derived, its overall performance (discrimination, calibration) is assessed. A reason for good performance might be that a simple rule, with a small number of highly predictive variables, is much less likely to be over-fitted (over-optimistically estimated) than complex models including also additional but weak predictors.8
The validation of a CPR can be done by using derivation study data (narrow internal validation), new data from the same source as the derivation study or other, similar populations (narrow external validation), but a true evaluation of predictive performance and generalizability (also called “transportability”) requires an evaluation in a heterogeneous population and another clinical setting/s (broad external validation).9,10 The proper validation implies that a fully specified, originally existing model (both the derivation study variables and coefficients) is used to compute the probability and obtain predicted outcomes and then compare the estimates to the actual outcomes in the validation study.11
Unfortunately, the predictive performance often decreases when a model is tested in new patients, different from those in the original model. Therefore, the CPR can be further adjusted or updated by combining the initial information (derivation study) and the new data (validation study).12–14
Predictive performance of a CPR
The predictive performance, or accuracy and reliability of a CPR in both derivation and validation studies should always be assessed in two aspects: discrimination and calibration.15 Discrimination (accuracy) refers to the ability of CPR to correctly distinguish between presence and absence of the outcome, while calibration (reliability) is the agreement between predicted probabilities of occurrence and observed proportions of the outcome. Discrimination of binary outcomes, for instance, is evaluated by concordance (c-statistic or receiver operating characteristic [ROC] curve). Good calibration refers to a good agreement between predicted probabilities and observed frequencies, eg, overall or across different strata by various CPR levels (ie, cut-off points). It is quantified by the comparison between, or ratio of the predicted to observed outcomes, usually verified by Hosmer-Lemeshow goodness-of-fit test, however, this test has low power to identify miscalibration in small samples.16 Other tests of calibration are also applicable when IPD from validation studies do exist, however, without real IPD we used the Hosmer-Lemeshow test on “mimicked” IPD only as an illustration of some aspects of our methodological approach, eg, a (relative) change in the model calibration after an intercept adjustment. Another approach to assess calibration when IPD are not available is a direct comparison between the outcomes distribution (frequencies) in the original derivation sample and the outcome distribution in validation samples.
The latter technique is well illustrated by the association between the prognostic features of the CRB-65 rule (levels) and the risk distribution (%) for 30 day mortality among the derivation study and a single validation study (Figure 1).17 There is a clearly increasing risk with the increasing CRB-65 score (from 0 to 3). Although with a lower percentage of the outcome in the highest risk (4 points), the increasing trends are quite similar in both samples, in terms of both the score distribution and outcome distribution. While with good discrimination (area under the curve [AUC] ROC = 0.79; 95% CI, 0.65–0.92), the calibration in terms of outcome frequency (%) at each of the score levels is not perfect. This one-to-one comparison indicates that CRB-65 rule tends to under-predict mortality in the validation sample as compared to the derivation one (eg, CRB-65 score of 2 points relates to mortality of 8.2% versus 11.8%, Figure 1).
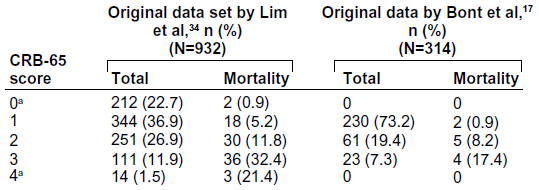 | Figure 1 An example of the comparison of prognostic features of CRB-65 rule in the view of predicting 30 day mortality from pneumonia between the derivation and a validation study. |
Discrimination should be prioritized when judging a set of predictions or an overall CPR performance because if discrimination is poor, no calibration adjustment or other similar refinements of reliability can correct such weak discrimination. If discrimination is good, the CPR reliability (calibration) can be improved by adjustment, without compromising discrimination.18 Different techniques are known to adjust a CPR for improving its predictive performance during the validation (eg, recalibration, remodeling, etc).14 For example, the Framingham score predicting 10-year cardiovascular disease (CVD) risk has been derived in the US population.19,20 Although with good discrimination and well calibrated to predict CVD events in populations from the USA, Australia, and New Zealand, it overestimates (over-predicts) the absolute risk in European cohorts and its direct implementation in the latter populations requires recalibration.20 An algorithm of CPR derivation and validation, including updating, is suggested (Figure A1.2 in Supplementary materials).
Systematic reviews and meta-analyses of CPRs
The number of derived or validated CPRs has been increasing recently.21 Several rules may predict the same outcome and, in parallel, a single rule may be validated in multiple populations and settings. Systematic reviews and, if appropriate, meta-analyses are the preferred tools to assess the prediction and level of evidence supporting the practical use of CPRs.22
Meta-analysis is used to summarize, evaluate, and present overall results of CPRs’ performance (pooled analysis) but most frequently in terms of discrimination23,24 rather than calibration.25,26 Pooled, symmetrical summary ROC or hierarchical summary ROC curves27,28 are used to assess discrimination (with a “gold standard” for observed outcomes) at a particular CPR threshold. To evaluate calibration, however, predicted number of outcomes should be published or possibly derivable from within each validation study. A good example of such calibration assessment with published or accessible predicted values (expressed as “predicted to observed ratio”) was reported in 200625 for the Framingham Anderson and Wilson scores for 10-year CVD risk (Figure A1.3). Interestingly, when all validation studies are ordered by the increasing observed CVD risk (top to bottom), a clear pattern of changing calibration, from over-prediction to under-prediction (from right to left) emerges.25
However, such calibration assessment cannot be done if no predicted values are published or accessible from validation studies. In principle, one possible approach in such situations is to estimate outcomes by using, for instance, the CPR as a predictor in a validation study. The predicted probabilities and the number of predicted outcomes can be computed by univariable (only CPR as predictor) or multivariable models (including also other covariates). Such computation of individual probabilities is not always an immediate procedure – it often requires high-level statistical knowledge and sophisticated software or, at least, that the model equations and coefficients are published or accessible. If the latter are available, then even simple calculations with the coefficients is sufficient to produce the predicted probabilities. The main problem, when neither predicted values are published nor enough data are available (including IPD), is that none of above techniques can be used. Therefore, another, new approach is needed to predict probabilities and outcomes for the assessment of calibration levels of CPRs in systematic reviews.
The aim of our present study was to introduce and describe a new, simple methodological approach which, using information from derivation study (eg, referred to as “derivation model”) allowed a calculation of the predicted values in validation studies. It is mainly applicable when individual participant, or patient data (database, IPD) are not available from all validation studies. The approach implies exploration of “predicted:observed” ratios in the usual meta-analytic way to assess CPR calibration (on a forest plot) and is illustrated by two rules: ABCD2 and CRB-65.29,30–31 The first objective was to employ the frequency distribution (%) of the observed outcomes in the derivation study and to apply it to predict the outcomes in a sample validation study. As a second objective, we aimed at confirming the functionality of the approach by using LR model coefficients from the derivation study to the validation study data. As a third objective, we aimed at assessing the role of different outcome incidences (a priori probabilities) from different validation studies, adjusting the original model intercept13 and examining the CPR performance and pooled estimates from the meta-analysis. Only the main ABCD2 rule results are reported in the main text (the remaining, including those on the CRB-65 rule, are shown in the Supplementary materials only).
Methods
To develop and illustrate our new approach, we utilized data from ABCD2 rule to predict stroke in transient ischemic attack patients and CRB-65 rule to predict mortality in pneumonia patients. With the purpose of simulating IPD sets, we selected only validation studies with available numbers of patients and outcome distribution (%) at each scoring point. Also, both CPRs were derived from LR models without complex interaction terms,33,34 ie, only with single predictors (variables). It means that the numerical “weights” of the components (predictors) in the CPRs were based only on fitted LR model coefficients, therefore, the patients had the same ranking in the models as in the CPRs (both related to predicted probability).
The outcome in ABCD2 rule was “stroke at 7 days” while that for the CRB-65 rule was “30 day in-hospital mortality”.30,31 The results, in terms of calibration, are shown as “predicted:observed” RRs with 95% CIs. The RR <1 indicates under-prediction (under-estimation) of stroke or death (observed number is greater than predicted number); RR >1 indicates over-prediction (over-estimation) of the outcome (observed number is less than the predicted number) while RR =1 indicates perfect calibration between observed and predicted values. Pooled estimates were calculated by fixed and random effect models while heterogeneity across studies was quantified by the I2-index.
New, simplified approach to derive predicted values in a validation study
The outcome distributions in derivation33 and validation studies of ABCD2 rule, overall and according to three strata of stroke risk (scores 0–3, 4–5, and 6–7), are presented in Figure A1.4 and Table A1.1 (Supplementary materials). The distribution in the original derivation study (column 3, Table 1) was used as a “predictive model” to which a validation study was to be related. To calculate the predicted number of strokes in the validation cohort,33 the proportionate risk estimate from the derivation cohort was applied according to each separate stratum of risk: low (stroke risk =1.35%), intermediate (6.51%), and high (11.30%) (column 5, Table 1). The number of strokes across the strata of risk in the validation cohort as predicted by ABCD2 rule “derivation model” (column 6, Table 1) was then compared to the observed strokes (column 7, Table 1). It should be noted that our new simplified approach is applicable not only to the whole sample (range) of such CPR score, overall, but if sufficient data exist (as in the example in Figure 1) – also to each one of the individual levels of the scoring (point) system of such CPR.
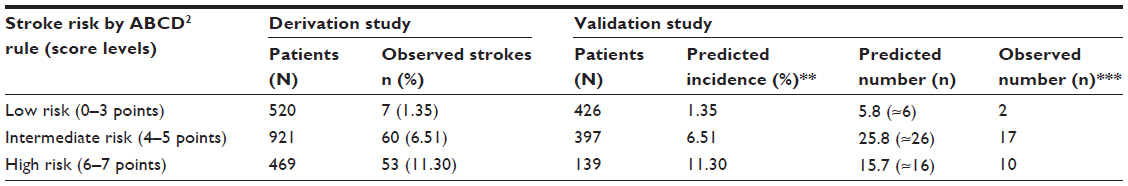 | Table 1 Observed and predicted number of strokes in the validation sample using the distribution patterns of strokes in the derivation sample as a predictive model* |
Respectively, outcome distributions in derivation and validation studies of the CRB-65 rule are presented in Figure A2.1 and Table A2.1A (Supplementary materials) while the results from the application of the new approach to compute predicted deaths in sample validation study35 are presented in Tables A2.1B-C (Supplementary materials).
Predicted values from the coefficients of the regression model
The next step was to confirm our findings in terms of feasibility, functionality, and agreement with other existing approaches or models (ie, to test construct or convergent validity) by using predicted outcomes by ABCD2 rule.33 We constructed a univariate saturated LR prediction model and its coefficients from the derivation study data. Since we did not have the original IPD, the only technique was to assume a dichotomous outcome (binary variable for stroke at 7 days: present = Yes =1 and absent = No =0) and include the ABCD2 rule as a single, independent predictor. The ABCD2 score (range 0–7) is not a true continuous variable and thus we avoided an assumption of linearity by including ABCD2 rule in the model as a set of discrete independent categorical variables, with score in the low-risk ABCD2 stratum (0–3) as a reference category.36 We converted the ABCD2 variable into two dummy, related dichotomous variables (one related to intermediate risk, 4–5 score and the other to high risk, 6–7 score) and included them into multiple regression model as two single predictors from the derivation study (Figure 2: panel A). The same technique for dummy variables was also successfully applied to the risk-stratified data from ABCD2 validation study33 (Figure 2: panel B) to use these data to apply the “derivation study” model and its coefficients (see below).
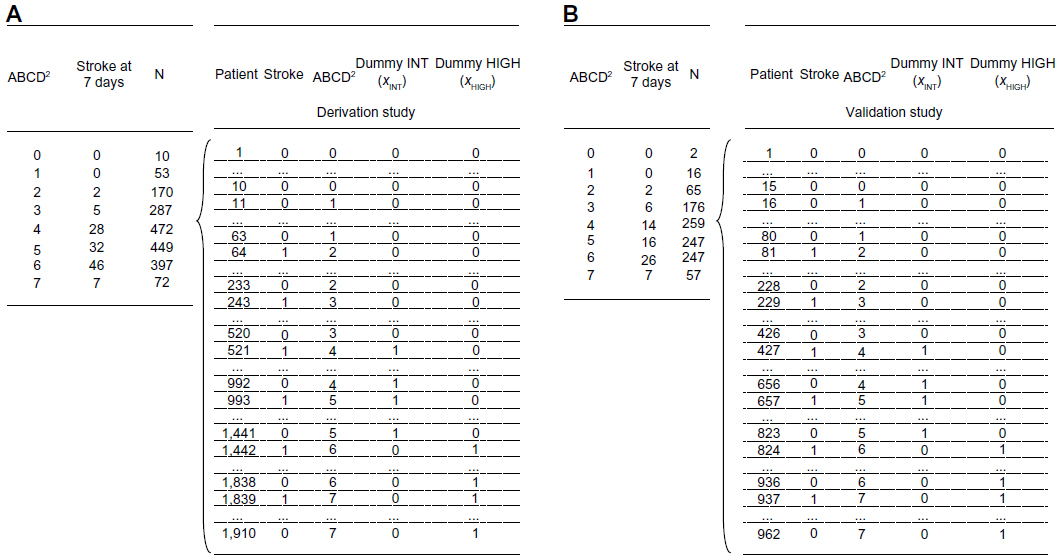 | Figure 2 Creation of dummy variables for the ABCD2 rule to perform logistic regression analysis at individual level. |
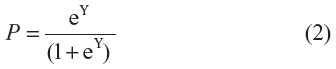
The equation of the prediction model in the derivation study of the ABCD2 rule is:
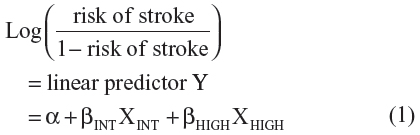
where α is the intercept and βINT and βHIGH are the regression coefficients of the dummy variables “intermediate risk” and “high risk”, respectively. The predicted probability of stroke for each simulated individual patient can be calculated as:
We obtained the regression equation with the predictors and their coefficients as:

For instance, if a patient ABCD2 score in the derivation study has been computed as either 0, 1, 2 or 3 points (low-risk, score 0–3), this patient would get Y=−4.29 resulting in a probability of 1.35% (95% CI 0.6–2.8) to have a stroke in 7 days. A patient ABCD2 score of 4 or 5 points would get Y=−4.29+1.63=−2.66 resulting in 6.51% (95% CI 5.1–8.3). Similarly, a patient ABCD2 score of 6 or 7 will get Y=−4.29+2.23=−2.06 resulting in 11.3% (95% CI 8.7–14.5).
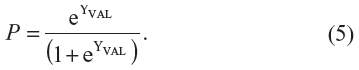
As mentioned, we used above “derivation study” coefficients to predict probabilities and number of strokes in the validation study (ie, using dummy variables as in Figure 2: panel B). The linear estimate YVAL in the validation study33 (column 6, Table 2) was calculated as:
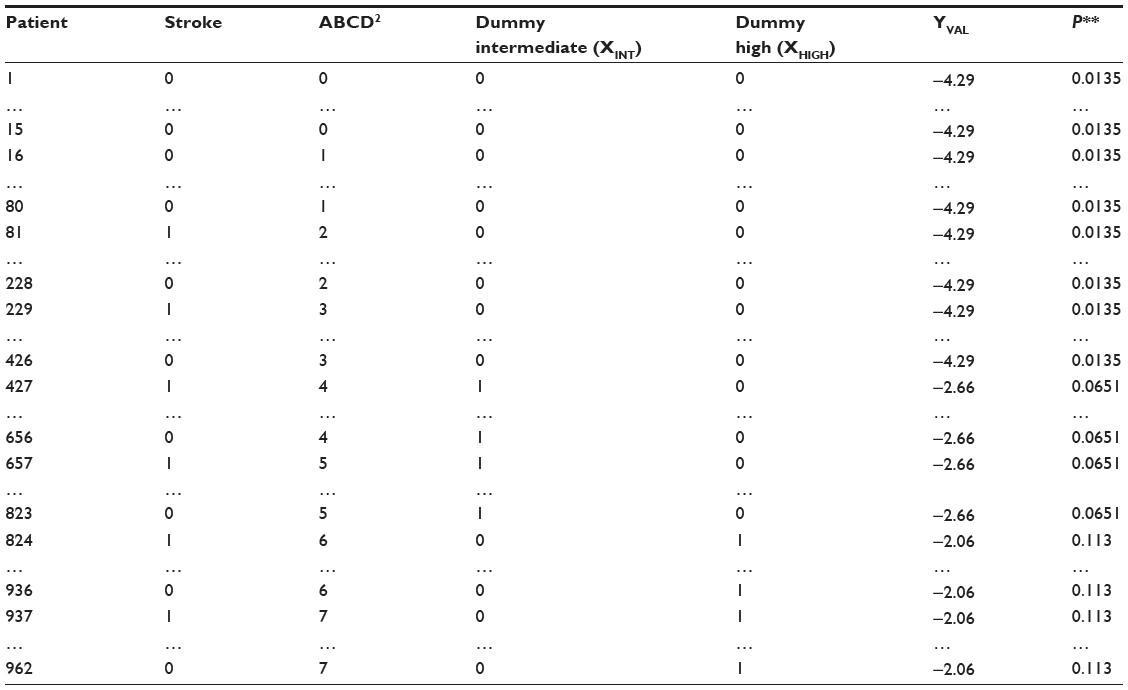 | Table 2 Individual patient probability P for stroke in the validation sample* as computed by the logistic regression equation (intercept and coefficients) from the derivation study |

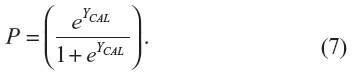
where αDER (−4.29) is the intercept and βINT,DER (1.63) and βHIGH,DER (2.23) are the coefficients from the derivation study (see equation (3) above). The XINT,VAL and XHIGH,VAL are the ABCD2 values as dummy variables data (“intermediate risk” and “high risk” strata) from the validation study (Figure 2: panel B). In this way, the predicted probability of stroke at individual level P (last column, Table 2), ie, for each simulated patient, was computed as:
Then we added up the individual probabilities P in Table 2 (last column) to predict the number of strokes within each separate stratum of risk: low-risk 0–3 (expected =5.7), intermediate risk 4–5 (25.9) and high risk 6–7 (15.7). When rounded, these expected values give 6, 26 and 16 predicted strokes (last column, Table 3).
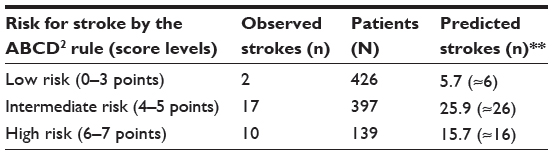 | Table 3 Observed and predicted numbers of strokes in the validation study* as computed by the use of the individual level probabilities P from the logistic regression equation with dummy variables |
The same algorithm, confirming the validity of our new approach to predict 30 day mortality by CRB-65 rule, is presented in the Supplementary materials (Tables A2.2A-D).
Meta-analysis, performance measures, and adjustment of intercept (updating) in validation studies
The predicted number of strokes and predicted:observed RRs in validation studies of ABCD2 rule are computed and subjected to meta-analysis with fixed and random-effects models. The results are presented as pooled estimates of RRs, together with measures of discrimination, calibration, and heterogeneity (Tables 4 and 5 and forest plots in Figures 3–5). Updating the intercept of original LR model corrects the calibration “at large”, that is, it “adjusts” the mean predicted probability for the latter to become equal to frequency of the observed outcome. Only the intercept of the original model (derivation study) is adjusted. This can be achieved by fitting LR model in validation study with the intercept α as the only free parameter and the linear estimate YVAL as an offset variable (ie, the slope is fixed at unity).14 The following equation illustrates the adjustment procedure:
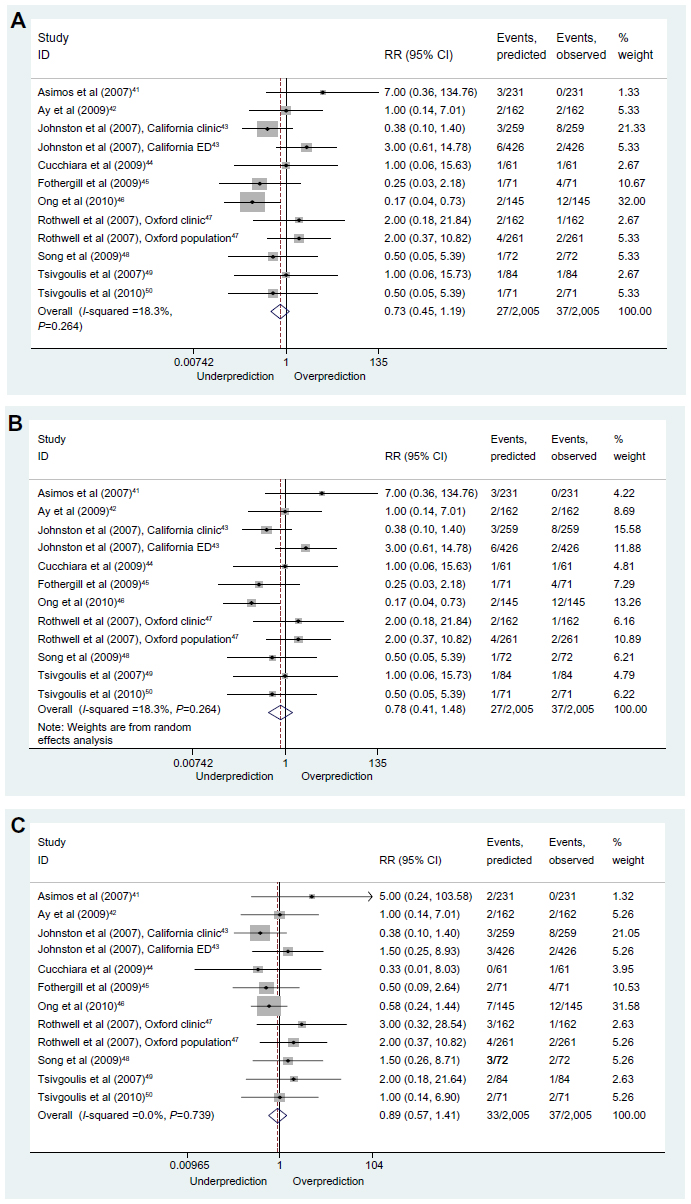 | Figure 3 Forest plots of the ABCD2 rule (low risk). |
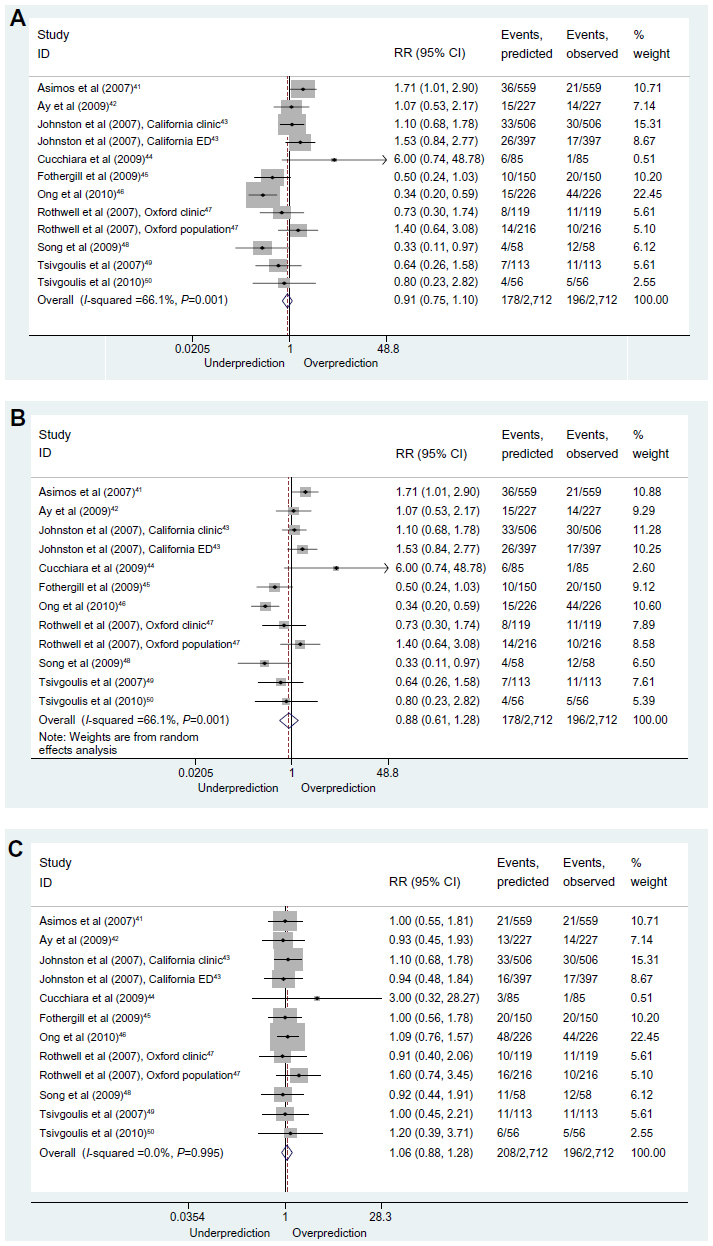 | Figure 4 Forest plots of the ABCD2 rule (intermediate risk). |
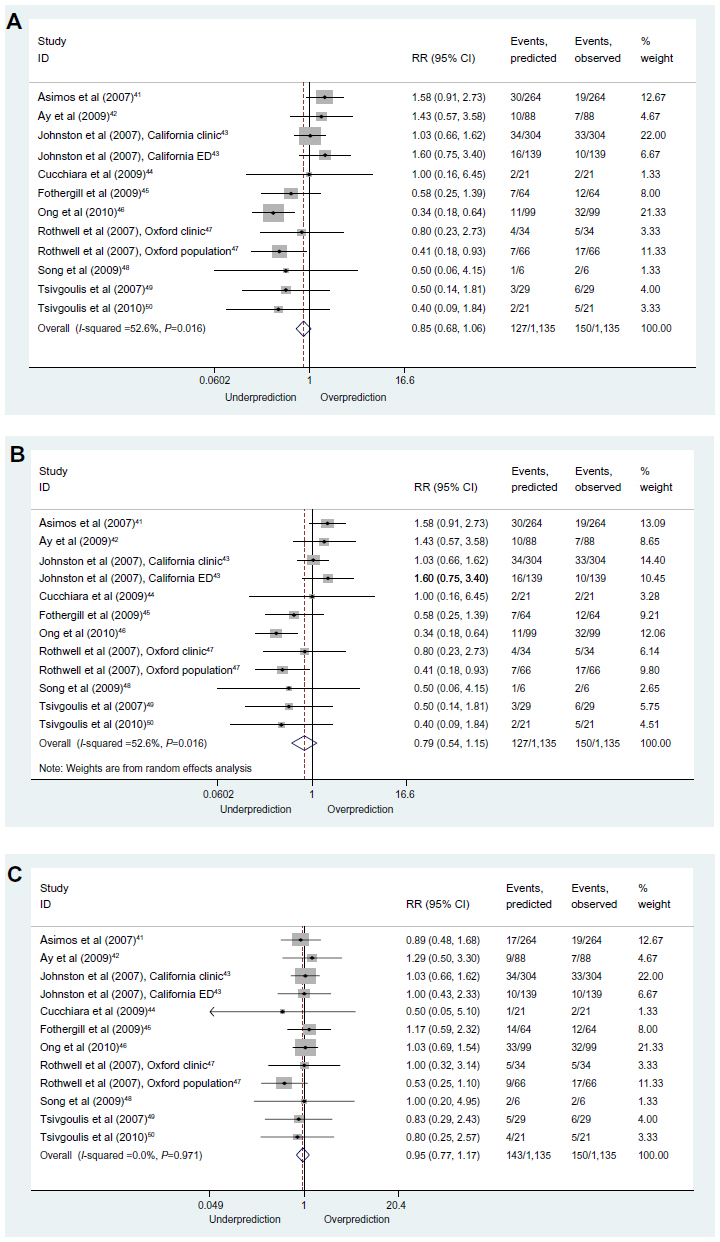 | Figure 5 Forest plots of ABCD2 (high risk). |
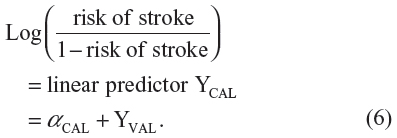
Then, the predicted probability of stroke for each separate validation study of the ABCD2 rule was calculated with the usual equation:
Once the probabilities with the adjusted intercepts are obtained for each simulated patient, the adjusted results from the meta-analysis with fixed effects can be presented for comparison purposes, in the same way, with the measures of performance and heterogeneity (Tables 4 and 5 and forest plots in Figures 3–5: panel C) as described in more detail in the section “Results”.
The same computations from a meta-analysis (without and with adjustment) on the estimates of 30 day mortality by CRB-65 rule in validation studies are presented only in Supplementary materials (forest plots in Figures A2.3.1, A2.3.2, and A2.3.3, Table A2.4 and Table A2.5).
Results
The main result of our current methodological work was the introduction of a new, simplified approach to compute predicted values and derive “predicted:observed” ratio of outcomes and assess calibration in validation studies of CPRs. This was achieved by using information from the derivation study (eg, referred to as “derivation model”) (Table 1).
As the main example we used the ABCD2 rule to predict the number of strokes and the approach was confirmed in terms of construct and congruent validities of predicted estimates. Using simulated IPD with dummy variables, we fitted a CPR-based LR model with its coefficients from the derivation study to data from sample validation study (Figure 2 and Table 2). We obtained the same number of predicted outcomes (Table 3) as computed by our new, simplified approach (Table 4). The identical results obtained by the new simplified approach (using a linear scale distribution from derivation sample onto the validation sample, ie, as from 0 to 7 points) and by the non-linear, more complex logistic relationship with the dummy variables to get individual predicted probabilities, is confirmation of its validity. Our current analysis included derivation and validation studies that ranged in size from 136 to 1,054 patients (ABCD2 rule) and from 137 to 1,100 patients (CRB-65 rule) (Supplementary materials: Figure A1.4, Table A1.1, Figure A 2.1, Table A 2.1A). Additional information on the validation studies and further details were reported earlier.30,31
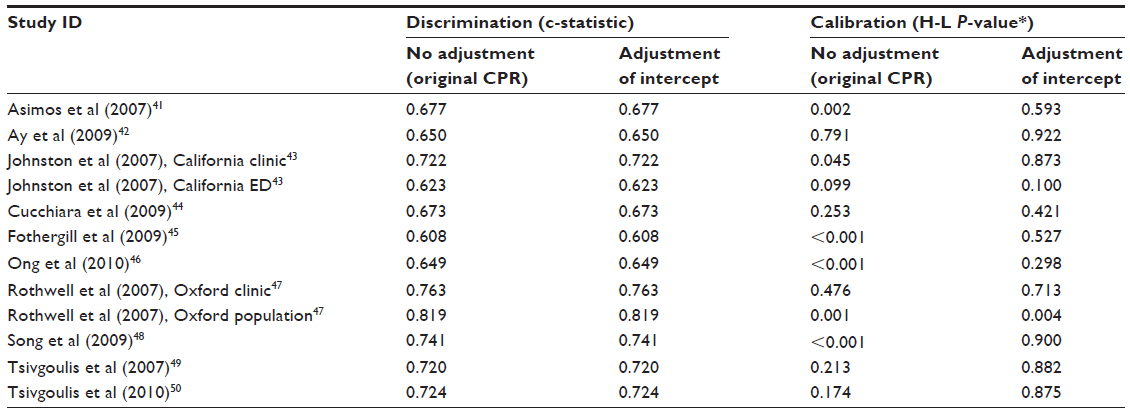 | Table 4 Performance of the ABCD2 rule in validation studies |
To further illustrate usefulness of our new approach in assessing the CPR predictive performance in terms of calibration, we obtained predicted outcomes and “predicted:observed” ratios in the validation studies and subjected them to formal meta-analysis. We thoroughly assessed the discrimination and calibration in each included validation study of the ABCD2 rule (Table 4) and we also illustrated with forest plots the summary estimates of calibration (pooled RRs with their 95% CIs), together with levels of heterogeneity (Figures 3–5). Notably, beyond overall good discrimination across all included studies (c-statistics 0.608–0.819), calibration levels in some of the studies were low, with a tendency of under-estimation (under-prediction). The latter tendency can be more clearly observed when illustrated by the level of assumed risk of stroke as defined by different levels of ABCD2 rule score (low: 0–3, intermediate: 4–5 and high: 6–7 points, Table 5).
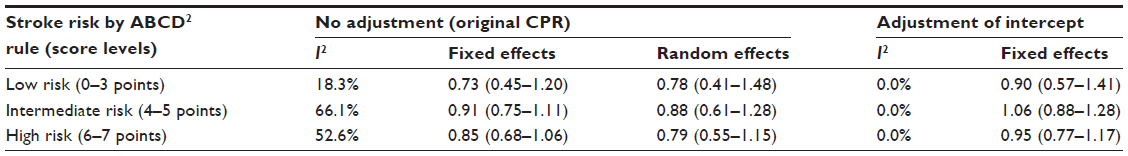 | Table 5 Meta-analysis with pooled RRs and 95% CIs from the validation studies of the ABCD2 rule – comparison between our new approach (original CPR) and an updated logistic regression model |
The slight under-prediction (RR from 0.73 to 0.91, 95% CIs include 1.00), possibly due to increased heterogeneity (18.8%–66.1%) in some of the risk strata, could be further corrected by adjustment of the original intercept to take into account the different incidence rates (a priori probabilities). In this way our new, simplified approach was able to identify low calibration levels (eg, under-prediction) which could be further refined. While discrimination does not improve further by such intercept adjustment (Table 4), better calibration coefficients (Table 4, last column) and improved pooled estimates (RR 0.90–1.06, Table 5), with narrower 95% CIs and zero heterogeneity were achieved.
Discussion
CPRs are a valuable tool in supporting clinicians, especially in primary care, in making evidence-based decisions when relying on clinical history, physical examination, and basic investigations. We employ a pragmatic approach to introduce new, simplified methodology of computing the predicted number and “predicted:observed” ratio of outcomes in validation studies of CPRs for assessing calibration in systematic reviews.
Main results
In the context of previous research on CPR validation where preference was always given to discrimination rather than calibration, our current results indicate the usefulness, feasibility, and validity (construct and congruent) of our new approach for calibration assessment. Producing predicted outcomes and pooled estimates of calibration, based on the frequency distribution pattern (%) of the outcome in the CPR derivation study, is denoted as a “derivation model”.
The clinical need for assessing calibration of CPR, and possibly improving it, has been clearly shown by discrepancies in the application of the Framingham score for 10-year CVD risk in European populations.19,20 While being calibrated in populations from the USA, Australia, and New Zealand, it overestimates (over-predicts) the absolute risk in Europe and requires further recalibration.20 A systematic review of validation studies even indicated that an interesting, newly detected dynamic pattern from over-prediction to under-prediction emerges with the increase of the observed risk.25 However, the above conjectures about calibration could never have been made if the predicted outcomes had not existed in CPR validation studies or were not accessible.
Our new approach is very useful in producing predicted outcomes by CPRs when needed for: i) assessment of calibration levels and/or subsequent inclusion of validation studies in meta-analysis; ii) signaling miscalibration and measuring improvements of calibration by updating (eg, adjustment of the intercept of derivation model); iii) comparison with predicted values as computed by other models and techniques (eg, confirmation of construct validity in ABCD2 and CRB-65 rules); and iv) further testing and, if necessary, refinement and improvement in terms of transportability with assessment and comparison of calibration between different but similar CPRs for the same outcome in same or different validation populations. To note, the same approach is also applicable to systematic reviews of validation studies for prediction of long-term risk of stroke after transient ischaemic attack.32
Limitations
One limitation of our approach is that the pooled analysis does not consider the specific frequency of the outcomes in each separate study; however, such assessment of calibration may be seen also as a new way for preliminary analysis to quantify, beyond the discrimination, the level of CPR calibration and to decide whether or not a rule should be recalibrated (eg, intercept adjustment). This is especially useful when IPD from validation studies are neither available nor easily accessible. Second, the CPR calibration might be influenced by the incidence in a separate validation study. However, before any further advice is given for recalibration, the predicted values and estimated calibration (ie, predicted versus observed values with their 95% CIs) can be adjusted to or computed for a range of different incidences. The latter approach was successfully applied in meta-analysis of validation studies of Centor score.37 For instance, the post-test probabilities of group A beta-hemolytic streptococcal pharyngitis were computed in a tabular form for a range of pre-test (prevalence) probabilities by the Poses’s method38 using the likelihood ratio formulation of the Bayes’ theorem to adjust for different prevalence rates. Last but not least, in the current approach we used each of the tested CPRs as single (solely) predictor of the outcome, however, these rules had components (signs or symptoms) with more or less the same weight (1 or 2 points each) and the underlying models had no complex interaction terms.
Clinical relevance and future research
Our results have immediate clinical application in the view of summarizing best available evidence (systematic review) from validation studies of CPRs. They allow subjecting each study’s data to formal meta-analysis to produce pooled estimates not only of discrimination, but also of calibration by applying previously published models (derivation study) to a new, validation population. Unfortunately, currently only about half of the derived CPRs in primary care have been validated and only a few have been assessed for clinical impact.39 As another recent study has also emphasized,40 the use of appropriately validated and tested CPRs is one of the best ways of implementing evidence-based medicine for diagnosis and prognosis in the clinical practice. In this sense we suggest that all systematic reviews with meta-analysis of CPR, as well as all validation studies, always report both discrimination and calibration analyses. Finally, the potential gain in predictive accuracy and generalizability of CPR developed on combined datasets, with IPD from various studies on the same outcome (ie, IPD meta-analysis) is an area of recently intensified research that warrants further investigations.
Conclusion
In summary, our current study has presented a new, simplified method for computation of predicted number of outcomes in validation studies of CPRs for assessment of calibration performance. This method is based on the frequency distribution pattern of derivation study outcomes. We illustrated the development and application of this new approach (ie, “derivation model”) on two clinically relevant and widely used CPRs (ABCD2 and CRB-65).
Our new approach was tested and further confirmed in terms of functionality and validity by original, univariate, CPR-based LR modeling (ie, with dummy variables) using derivation study data. The application of coefficients from this regression model to a sample validation study produced virtually identical predicted values of stroke across the three risk strata of ABCD2 score (low, 0–3; intermediate, 4–5; high, 6–7 points). Then, by using our new method, we successfully computed predicted values in all included validation studies and obtained pooled estimates of “predicted:observed” RRs with their 95% CIs. Given the good discrimination performance, the slight under-prediction of strokes was further improved by intercept adjustment to show how different incidences of the outcome in each validation study can be considered and thus, providing further evidence on the usefulness of our approach. Once such miscalibration in a meta-analysis is signaled by our new approach, further refinements of the original intercept are possible by more sophisticated modeling exercises. Similarly, the successful application of our new method was also illustrated on the CRB-65 rule (Supplementary materials).
When predicted outcomes are neither published nor sufficient as from within validation studies of CPRs, or no IPD are available, our simplified approach illustrates, for the first time, how predicted outcomes can be obtained by everyone, when using only derivation study, without any further requirements for highly-specialized knowledge or sophisticated analyses. Last but not least, our new results have immediate clinical implication in contributing to exploration of the best available evidence from validation studies of CPRs (ie, systematic reviews). They allow not only subjecting the data to meta-analysis for computation of discrimination but also to produce pooled estimates for evaluation of calibration in new, validation populations.
Acknowledgments
The authors thank Dr Kathleen Bennett (Trinity College Dublin) for her helpful comments during the manuscript preparation. This work was supported by the Health Research Board (HRB) of Ireland under Grant HRC/2007/1. Presented in part as poster at the 32nd Conference on Applied Statistics in Ireland, May 2012, Dundalk, Ireland.
Disclosure
The authors report no conflicts of interest in this work.
References
Knottnerus JA. Diagnostic prediction rules: principles, requirements, and pitfalls. Prim Care. 1995;22(2):341–363. | |
Reilly BM, Evans AT. Translating clinical research into clinical practice: impact of using prediction rules to make decisions. Ann Intern Med. 2006;144(3):201–209. | |
McGinn TG, Guyatt GH, Wyer PC, et al. Users’ guides to the medical literature XXII: How to use articles about clinical decision rules. JAMA. 2000;284(1):79–84. | |
Laupacis A, Sekar N, Stiell IG. Clinical prediction rules. A review and suggested modifications of methodological standards. JAMA. 1997;277(6):488–494. | |
Fahey T, Van der Lei J. Producing and using clinical prediction rules. In: Knottnerus A, Buntinx F, editors. The Evidence Base of Clinical Diagnosis: Theory and methods of diagnostic research. Second Edition. Oxford: Blackwell Scientific; 2009:213–236. | |
Vergouwe Y, Steyerberg EW, Eijkemans MJ, Habbema JD. Validity of prognostic models: when is a model clinically useful? Semin Urol Oncol. 2002;20(2):96–107. | |
Steyerberg EW. Clinical Prediction Models: A Practical Approach to Development, Validation and Updating. New York: Springer; 2009. | |
Rothwell PM. Prognostic models. Pract Neurol. 2008;8:242–253. | |
Altman DG, Royston P. What do we mean by validating a prognostic model? Stat Med. 2000;19(4):453–473. | |
Bleeker SE, Moll HA, Steyerberg EW, et al. External validation is necessary in prediction research: a clinical example. J Clin Epidemiol. 2003;56(9):826–832. | |
Altman DG, Vergouwe Y, Royston P, Moons KG. Prognosis and prognostic research: validating a prognostic model. BMJ. 2009;338: 1432–1435. | |
Ivanov J, Tu JV, Naylor CD. Ready-made, recalibrated, or Remodeled? Issues in the use of risk indexes for assessing mortality after coronary artery bypass graft surgery. Circulation. 1999;99(16):2098–2104. | |
Toll DB, Janssen KJ, Vergouwe Y, Moons KG. Validation, updating and impact of clinical prediction rules: A review. J Clin Epidemiol. 2008;61(11):1085–1094. | |
Janssen KJ, Moons KG, Kalkman CJ, Grobbee DE, Vergouwe Y. Updating methods improved the performance of a clinical prediction model in new patients. J Clin Epidemiol. 2008;61(1):76–86. | |
Harrell FE Jr, Lee KL, Mark DB. Multivariable prognostic models: issues in developing models, evaluating assumptions and adequacy, and measuring and reducing errors. Stat Med. 1996;15(4):361–387. | |
Hosmer DW, Hosmer T, Le Cessie S, Lemeshow S. A comparison of goodness-of-fit tests for the logistic regression model. Stat Med. 1997; 16(9):965–980. | |
Bont J, Hak E, Hoes AW, Macfarlane JT, Verheij TJ. Predicting death in elderly patients with community-acquired pneumonia: a prospective validation study re-evaluating the CRB-65 severity assessment tool. Arch Intern Med. 2008;168(13):1465–1468. | |
Lee KL, Pryor DB, Harrell FE Jr, et al. Predicting outcome in coronary disease. Statistical models versus expert clinicians. Am J Med. 1986;80(4):553–560. | |
Riddell T, Wells S, Jackson R, et al. Performance of Framingham cardiovascular risk scores by ethnic groups in New Zealand: PREDICT CVD–10. N Z Med J. 2010;123(1309):50–61. | |
Eichler K, Puhan MA, Steurer J, Bachmann LM. Prediction of first coronary events with the Framingham score: A systematic review. Am Heart J. 2007;153(5):722–731. | |
Brehaut JC, Stiell IG, Visentin L, Graham ID. Clinical decision rules “in the real world”: How a widely disseminated rule is used in everyday practice. Acad Emerg Med. 2005;12(10):948–956. | |
Egger M, Smith GD, Altman DG. Systematic Reviews in Health Care: Meta-Analysis in Context. London: BMJ; 2001. | |
Giles MF, Rothwell PM. Systematic Review and Pooled Analysis of Published and Unpublished Validations of the ABCD and ABCD2 Transient Ischemic Attack Risk Scores. Stroke. 2010;41(4);667–673. | |
Hess EP, Agarwal D, Chandra S, et al. Diagnostic accuracy of the TIMI risk score in patients with chest pain in the emergency department: a meta-analysis. CMAJ. 2010;182(10):1039–1044. | |
Brindle P, Beswick A, Fahey T, Ebrahim S. Accuracy and impact of risk assessment in the primary prevention of cardiovascular disease: a systematic review. Heart. 2006;92(12):1752–1759. | |
Eichler K, Puhan MA, Steurer J, Bachmann LM. Prediction of first coronary events with the Framingham score: A systematic review. Am Heart J. 2007;153(5):722–731. | |
Zamora J, Abraira V, Muriel A, Khan K, Coomarasamy A. Meta-DiSc: a software for meta-analysis of test accuracy data. BMC Med Res Methodol. 2006;6:31. | |
Harbord RM, Whiting P. Metandi: Meta-analysis of diagnostic accuracy using hierarchical logistic regression. The Stata Journal. 2009;9(2):211–229. | |
Ho KM. Forest and funnel plots illustrated the calibration of a prognostic model: a descriptive study. J Clin Epidemiol. 2007;60(7):746–751. | |
McNally M, Curtain J, O’Brien KK, Dimitrov BD, Fahey T. Validity of British Thoracic Society guidance (the CRB-65 rule) for predicting the severity of pneumonia in general practice: systematic review and meta-analysis. Br J Gen Pract. 2010;60(579):e423–e433. | |
Galvin R, Geraghty C, Motterlini N, Dimitrov BD, Fahey T. Prognostic value of the ABCD2 clinical prediction rule: a systematic review and meta-analysis. Fam Pract. 2011;28(4):366–376. | |
Galvin R, Atanassova PA, Motterlini N, Fahey T, Dimitrov BD. Long-term risk of stroke after transient ischaemic attack: a hospital-based validation of the ABCD2 rule. BMC Res Notes. 2014;7(1):281. | |
Johnston SC, Rothwell PM, Nguyen-Huynh MN, et al. Validation and refinement of scores to predict very early stroke risk after transient ischaemic attack. Lancet. 2007;369(9558):283–292. | |
Lim WS, van der Eerden MM, Laing R, et al. Defining community acquired pneumonia severity on presentation to hospital: an international derivation and validation study. Thorax. 2003;58(5):377–382. | |
Man SY, Lee N, IpM, et al. Prospective comparison of three predictive rules for assessing severity of community-acquired pneumonia in Hong Kong. Thorax. 2007;62(4):348–353. | |
Merwick A, Albers GW, Amarenco P, et al. Addition of brain and carotid imaging to the ABCD² score to identify patients at early risk of stroke after transient ischaemic attack: a multicentre observational study. Lancet Neurol. 2010;9(11):1060–1069. | |
Aalbers J, O’Brien KK, Chan WS, et al. Predicting streptococcal pharyngitis in adults in primary care: a systematic review of the diagnostic accuracy of symptoms and signs and validation of the Centor score. BMC Med. 2011;9:67. | |
Poses RM, Cebul RD, Collins M, Fager SS. The importance of disease prevalence in transporting clinical prediction rules. The case of streptococcal pharyngitis. Ann Intern Med. 1986;105(4):586–591. | |
Keogh C, Wallace E, O’Brien KK, et al. Developing an International Register of Clinical Prediction Rules for use in primary care: A descriptive analysis. Ann Fam Med. 2014;12(4):359–366. | |
Plüddemann A, Wallace E, Bankhead C, et al. Clinical prediction rules in practice: review of clinical guidelines and survey of GPs. Br J Gen Pract. 2014;64(621):e233–242. | |
Asimos AW, Johnston AM, Rosamond WD, et al. A multicenter evaluation of the ABCD2 scores accuracy for predicting early ischaemic stroke in admitted patients with transient ischaemic attack. Ann Emerg Med. 2010;55:201–210. | |
Ay H, Arsava EM, Johnston SC, et al. Clinical and imaging based prediction of stroke risk after transient ischaemic attack. Stroke. 2009;40:181–186. | |
Johnston SC, Gress DR, Browner WS, Sidney S. Short term prognosis after emergency department diagnosis of TIA. JAMA. 2000;284:2901–2906. | |
Cucchiara BL, Messe SR, Sansing L, et al. Lipoprotein associated phospholipase A2and C-reactive protein for risk stratification of patients with TIA. Stroke. 2009;40:2332–2336. | |
Fothergill A, Christianson TJH, Brown RD, Rabinstein AA. Validation and refinement of the ABCD2 score: a population based analysis. Stroke. 2009;40:2669–2673. | |
Ong MEH, Chan YH, Lin WP, Chung WL. Validating the ABCD2 score for predicting stroke risk after transient ischemic attack in the ED. Am J Emerg Med. 2010;28:44–48. | |
Rothwell PM, Giles MF, Flossmann E, et al. A simple score (ABCD) to identify individuals at high early risk of stroke after transient ischaemic attack. Lancet. 2005;366:29–36. | |
Song T, Lu Z, Bo S, et al. Clinical application of the ABCD2 score system. Life Sci J. 2009;6:23–26. | |
Tsivgoulis G, Vassilopoulou S, Spengos K. Potential applicability of the ABCD2 score in triaging patients. Lancet. 2007;369:1082. | |
Tsivgoulis G, Stamboulis E, Sharma VK, et al. Multicenter external validation of the ABCD2 score in triaging TIA patients. Neurology. 2010;74:1351–1357. |
 © 2015 The Author(s). This work is published and licensed by Dove Medical Press Limited. The full terms of this license are available at https://www.dovepress.com/terms.php and incorporate the Creative Commons Attribution - Non Commercial (unported, v3.0) License.
By accessing the work you hereby accept the Terms. Non-commercial uses of the work are permitted without any further permission from Dove Medical Press Limited, provided the work is properly attributed. For permission for commercial use of this work, please see paragraphs 4.2 and 5 of our Terms.
© 2015 The Author(s). This work is published and licensed by Dove Medical Press Limited. The full terms of this license are available at https://www.dovepress.com/terms.php and incorporate the Creative Commons Attribution - Non Commercial (unported, v3.0) License.
By accessing the work you hereby accept the Terms. Non-commercial uses of the work are permitted without any further permission from Dove Medical Press Limited, provided the work is properly attributed. For permission for commercial use of this work, please see paragraphs 4.2 and 5 of our Terms.