")
Back to Archived Journals » Hypoxia » Volume 2
Arginine-vasopressin marker copeptin is a sensitive plasma surrogate of hypoxic exposure
Authors Ostergaard L, Rudiger A, Wellmann S, Gammella E, Beck-Schimmer B, Struck J, Maggiorini M, Gassmann M
Received 20 November 2013
Accepted for publication 20 January 2014
Published 11 September 2014 Volume 2014:2 Pages 143—151
DOI https://doi.org/10.2147/HP.S57894
Checked for plagiarism Yes
Review by Single anonymous peer review
Peer reviewer comments 4
Louise Ostergaard,1,2,* Alain Rudiger,3,* Sven Wellmann,2,4,5 Elena Gammella,6 Beatrice Beck-Schimmer,2,3 Joachim Struck,7 Marco Maggiorini,2,8 Max Gassmann,1,2,9
1Institute of Veterinary Physiology, Vetsuisse Faculty, University of Zürich, 2Zürich Center for Integrative Human Physiology, 3Institute of Anesthesiology, 4Division of Neonatology, University Hospital Zürich, Zürich, 5Department of Neonatology, University Children's Hospital Basel, Basel, Switzerland; 6Department of Human Morphology and Biomedical Science, University of Milan, Milan, Italy; 7Research Department, B•R•A•H•M•S Biomarkers, Thermo Fisher Scientific, Hennigsdorf, Germany; 8Medical Intensive Care Unit, University Hospital Zürich, Zürich, Switzerland; 9Universidad Peruana Cayetano Heredia, Lima, Peru
*These authors contributed equally to this work and share first authorship
Background: A reduced oxygen supply puts patients at risk of tissue hypoxia, organ damage, and even death. In response, several changes are activated that allow for at least partial adaptation, thereby increasing the chances of survival. We aimed to investigate whether the arginine vasopressin marker, copeptin, can be used as a marker of the degree of acclimatization/adaptation in rats exposed to hypoxia.
Methods: Sprague-Dawley rats were exposed to 10% oxygen for up to 48 hours. Arterial and right ventricular pressures were measured, and blood gas analysis was performed at set time points. Pulmonary changes were investigated by bronchoalveolar lavage, wet and dry weight measurements, and lung histology. Using a newly developed specific rat copeptin luminescence immunoassay, the regulation of vasopressin in response to hypoxia was studied, as was atrial natriuretic peptide (ANP) by detecting mid-regional proANP.
Results: With a decreasing oxygen supply, the rats rapidly became cyanotic and inactive. Despite continued exposure to 10% oxygen, all animals recuperated within 16 hours and ultimately survived. Their systemic blood pressure fell with acute (5 minutes) hypoxia but was partially recovered over time. In contrast, right ventricular pressures increased with acute (5 minutes) hypoxia and normalized after 16 hours. No signs of pulmonary inflammation or edema were found despite prolonged hypoxia. Whereas copeptin levels increased significantly after acute (5 minutes) hypoxia and then returned to near baseline after 16 hours, mid-regional proANP levels were even further increased after 16 hours of exposure to hypoxia.
Conclusion: Plasma copeptin is a sensitive marker of acute (5 minutes) exposure to severe hypoxia, and subsequent regulation can indicate recovery. Copeptin levels can therefore reflect clinical and physiological changes in response to hypoxia and indicate recovery from ongoing hypoxic exposure.
Keywords: vasoactive peptides, hypoxia, copeptin, atrial natriuretic peptide, acclimatization, adaptation, critical illness
Introduction
Low oxygen availability (eg, during perinatal asphyxia or exposure to high altitude) or impaired oxygen uptake (eg, due to acute respiratory distress syndrome in the critically ill) cause hypoxemia and physiological stress. The reaction to this potentially life-threatening situation requires both acute physiological changes as well as hypoxia-dependent gene regulation, which induce a variety of specific adaptation mechanisms that ensure survival at cellular and systemic levels.1,2 Various reactions and adaptation mechanisms have been described, including increased ventilation, decreased metabolic rate, right shift of the hemoglobin dissociation curve, and bicarbonate ion secretion,3,4 which are species-specific to some extent.5
Arteries of the systemic circulation dilate in response to hypoxia to transport as much oxygen as possible to hypoxic tissues. In contrast, arteries of the pulmonary circulation constrict to optimize the match between ventilation and perfusion. This functional change in vascular tone increases the pulmonary pressures.6 Because pulmonary vasoconstriction can be inhomogeneous, some lung areas become overperfused, which can cause pulmonary edema. This phenomenon has been described in mountaineers after rapid ascent to high altitudes, and is termed high altitude pulmonary edema, which is characterized by the development of protein-rich pulmonary edema.7 An important pulmonary vasodilating factor is atrial natriuretic peptide (ANP), which has been shown to reduce pulmonary arterial pressure, whereas it does not exert a significant effect on the systemic circulation.8
Cardiorespiratory adaptation to hypoxia involves the neuroendocrine system. Direct neuronal projections to the spinal cord, brainstem, and sites that control cardiorespiratory function increase ventilation (both tidal volume and frequency) and blood pressure (both heart rate and sympathetic nerve activity). Arginine vasopressin (AVP), a pituitary-secreted nonapeptide, reflects the stress response of the neuroendocrine system. Hypoxia can augment strong AVP release within a short time in various animal models.9–13 AVP is unstable, making its detection cumbersome; however, its secretion can be estimated by measuring copeptin, the C-terminal portion of the AVP precursor, which is released in an equimolar ratio to AVP.14
The objective of this study was to characterize the physiological response to acute versus prolonged hypoxia, with a focus on changes in plasma copeptin levels. This research will provide knowledge regarding the use of copeptin as a marker for hypoxic stress and the ensuing acclimatization.
Materials and methods
Hypoxic incubation of rats
All experiments were performed according to protocols approved by the local veterinary office (178/2008). Male Sprague-Dawley rats (Charles River Laboratories, Sulzfeld, Germany) were allowed to settle into a new environment for a week before exposure to hypoxia. The rats were placed in a hypoxic tent (Coy Laboratories, Grass Lake Charter Township, MI, USA) with free access to food and water for up to 48 hours. The tent was large enough for two cages containing four animals each. The oxygen content inside the tent was gradually decreased by insufflation of nitrogen from room air (21%) to achieve a level of 10% O2 within one hour. This condition mimics an altitude of almost 6,000 m above sea level.15 Control animals were kept in room air. Due to the size of the tent, no CO2 accumulation was detected. For the initial experiments, the rats were exposed to hypoxia for 8, 16, 24, and 48 hours; however, only minor changes were observed after 16 hours. Thus, the 16-hour time point was chosen for further evaluation.
HIF-1α immunoblotting
After 16 hours of hypoxia, the rats were anesthetized inside the hypoxic tent using an intraperitoneal injection of ketamine 200 mg/kg (Vétoquinol AG, Ittigen, Switzerland) and xylazine 20 mg/kg (Streuli Pharma AG, Uznach, Switzerland). The liver was rapidly excised and stored in liquid nitrogen. Liver tissue was homogenized in lysis buffer (10 mM Tris-HCl [pH 8], 1 mM ethylenediaminetetraacetic acid [EDTA, pH 8], 400 mM NaCl, 0.1% NP-40, 1 mM dithiothreitol, 1 mM phenylmethylsulfonyl fluoride, 1 mM orthovanadate, and protease inhibitor cocktail; Sigma-Aldrich, St Louis, MO, USA) and centrifuged for 10 minutes at 16,000× g. The proteins were separated by denaturing sodium dodecyl sulfate polyacrylamide gel electrophoresis, and after transfer to nitrocellulose, the membranes were blocked in 5% milk in phosphate-buffered saline for one hour at room temperature. Antibodies against hypoxia-inducible factor (HIF)-1α (NB 100–479, 1:1,000; Novus Biologicals, Littleton, CO, USA) were allowed to bind overnight at 4°C. The membrane was incubated with a horseradish peroxidase-conjugated secondary antibody for one hour at room temperature and then developed using chemiluminescent detection.
Hemodynamic measurements
The animals were transferred from the hypoxic tent to the bench in a plexiglass box, which was filled with isoflurane for induction of anesthesia. Isoflurane anesthesia was then provided via face mask. The oxygen concentration (either 10% or 21%) was maintained throughout using a custom-made anesthetic apparatus (Provet AG, Lyssach, Switzerland). The left carotid artery was dissected and cannulated with 0.58 × 0.19 mm Portex tubing (Scientific Laboratory Supplies Ltd, Hessle, UK) for systemic blood pressure measurements. A 2.2 F microtip pressure catheter (Model SPR-249 Mikro-Tip®, Millar Instruments, Houston, TX, USA) was inserted in the right internal jugular vein and advanced under pressure guidance into the right ventricle. After instrumentation, the isoflurane dose was reduced to 1.5%. Hemodynamic measurements were recorded with a Power Lab system (ADInstruments Ltd, Oxford, UK) and analyzed with Chart 7 software (ADInstruments Ltd). All pressures were taken at end of expiration. Arterial blood was drawn at set time points for automated blood gas analysis (ABL 800 Flex, Radiometer Medical ApS, Brønshøj, Denmark) and measurement of copeptin and mid-regional proANP (see below). The experimental timeline is summarized in Figure 1.
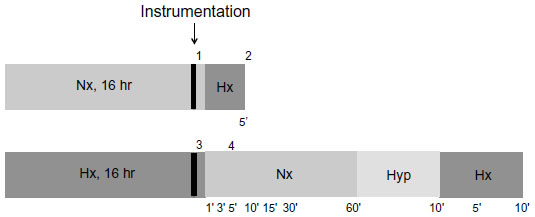 | Figure 1 Experimental timeline. After 16 hours of either normoxia or hypoxia, the animals were anesthetized and instrumented, and the systolic right ventricular pressure was measured at the following points: 1, normoxia at baseline; 2, acute hypoxia; 3, 16 hours of hypoxia; 4, recovery (normoxia, hyperoxia and hypoxia, with measurements as indicated in minutes). While the animals were under anesthesia, the inspired gas mixture was adjusted as illustrated, and blood was collected at the indicated time points. |
Histology
The animals were anesthetized after 16 hours of hypoxia while still inside the tent with an intraperitoneal injection of ketamine 200 mg/kg (Vétoquinol AG) and xylazine 20 mg/kg (Streuli Pharma AG). The organs were removed, placed in 4% formalin for 24 hours, and embedded in paraffin blocks. Slices (5 μm) were cut and stained with hematoxylin and eosin.
Lung and heart weights
Hearts and lungs were harvested from the animals for the HIF-1α experiments and rinsed. The right ventricle was carefully dissected, while the septum remained with the left ventricle. The lungs were heat-dried at 70°C for 48 hours, and weights were obtained before and after the procedure.
Bronchoalveolar lavage
Separate animals were anesthetized after 16 hours of hypoxia with an intraperitoneal injection of ketamine 200 mg/kg (Vétoquinol AG) and xylazine 20 mg/kg (Streuli Pharma AG). The animals were exsanguinated via an incision in the inferior vena cava, and the pulmonary circulation was perfused with ice-cold phosphate-buffered saline. Ice-cold phosphate-buffered saline (10 mL) was slowly instilled into and removed from the bronchoalveolar system five times via a tracheostomy. Total protein content was measured using the Bradford protein assay (Bio-Rad Laboratories, Inc., Hercules, CA, USA), whereas albumin was measured with a specific enzyme-linked immunosorbent assay kit (Bethyl Laboratories, Inc., Montgomery, TX, USA). The number of cells in the bronchoalveolar lavage fluid was evaluated by staining with trypan blue and counting in a Neubauer chamber.
Plasma copeptin and mid-regional proANP assay
After collecting blood into EDTA tubes, the samples were centrifuged, and the plasma was transferred to a new EDTA tube and subsequently frozen at −28°C. Measurement of plasma copeptin was performed in a single batch with a research sandwich immunoluminometric assay (C-terminal pro-AVP luminescence immunoassay; B·R·A·H·M·S GmbH, Hennigsdorf, Germany). Because the assay was developed for the detection of human plasma copeptin,14 it was not sufficiently cross-reactive with rat plasma copeptin. Thus, the tracer antibody of the assay was replaced with a purified sheep antibody developed against a peptide corresponding to amino acid positions 156–168 of rat pre-pro-vasopressin. Dilutions of a peptide corresponding to amino acid positions 136–168 of rat pre-pro-vasopressin were used as calibrators. All other assay conditions were the same as those described for the human copeptin assay. Mid-regional proANP in plasma was measured with a commercial assay, which was originally designed for measuring human mid-regional proANP (KRYPTOR MR-proANP; B·R·A·H·M·S GmbH) according to the manufacturer’s instructions.
Data analysis
The data are expressed as the mean ± standard deviation of the indicated number of observations. Statistical comparisons between groups were performed with the Student’s t-test or one-way analysis of variance (Newman – Keuls post-test), as appropriate. Differences were considered to be statistically significant at P<0.05.
Results
Observations after 16 hours of hypoxic exposure
With decreasing oxygen content inside the tent, the rats became progressively lethargic. When the oxygen concentration reached 10%, the animals were resting motionless, using their efforts only for deep breathing. The rats had paused eating/drinking and stopped grooming. Their skin color had turned cyanotic, which was most visible at the animals’ ears and tails. However, the condition of the animals improved over the following hours. They started eating/drinking and grooming again and resumed their social interactions. After 16 hours of hypoxia, the behavior of the rats had normalized, although the animals were still cyanotic. During the following observation period of up to 48 hours of hypoxia, no relevant changes in physical appearance, behavior, or other parameters were noted. Importantly, all animals survived the prolonged hypoxic exposure. At baseline, the animals weighed 293±3.9 g. After 8 and 16 hours of hypoxia, the animals had lost 6.2%±0.14% and 8.1%±0.67% (P<0.05) of their body weight, respectively (Figure 2). However, the decline in body weight stopped after 16 hours, and body weight remained similar thereafter until the end of the 48-hour observation period.
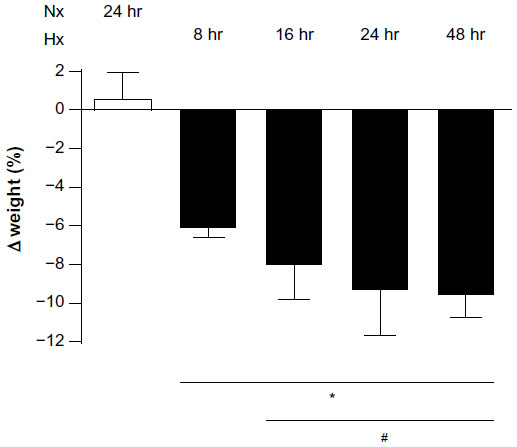 | Figure 2 Body weight gradually decreased with 8–24 hours of hypoxia, after which no further changes were observed. Weight loss is reported as a percentage by comparing the weight of the animal at the beginning of the experiment with that at the end. *P<0.05 versus normoxia at 24 hours; #P<0.05 versus hypoxia at 8 hours. |
Stabilization of HIF-1α in the liver
To verify that the animals were indeed reacting to the hypoxic conditions, stabilization of the transcription factor, HIF-1α, was verified in liver protein extracts from both hypoxic (16 hours) and normoxic animals (Figure 3).
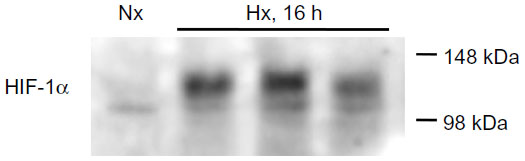 | Figure 3 Stabilization of HIF-1α in liver homogenates. Representative immunoblot of a normoxic control (first lane) compared with three hypoxic (16 hours) samples (lanes 2–4). All hypoxic liver samples (n=6) showed stabilization of HIF-1α. |
Systemic and pulmonary hemodynamics
Hemodynamic changes are shown in Table 1. Systemic blood pressure dropped significantly with acute (5 minutes) hypoxia but was partially normalized after 16 hours of hypoxia. Of note, systemic pulse pressure (ie, the difference between systolic and diastolic blood pressure) increased significantly with acute (5 minutes) hypoxia, whereas the heart rate dropped transiently. Respiration rate increased significantly with decreasing oxygen availability and remained slightly but not significantly elevated until the end of the hypoxic episode. Changes in right ventricular pressures are shown in Figure 4. Baseline values (28.6±0.8 mmHg) increased to 46.0±6.4 mmHg after acute (5 minutes) hypoxic exposure. After 16 hours of exposure to 10% oxygen, the pressure was again similar to baseline (31.0±1.4 mmHg), and with normoxic recovery, no further alteration was observed (29.6±2.1 mmHg). Peak right ventricular pressure, a surrogate for systolic pulmonary artery pressure, was significantly increased with acute (5 minutes) hypoxia. However, the pressures normalized over time, and the values at 16 hours were similar to those at baseline. End-diastolic right ventricular pressures did not change significantly over time (data not shown). In addition, we calculated the right ventricle to total heart weight ratio and found no significant changes (data not shown).
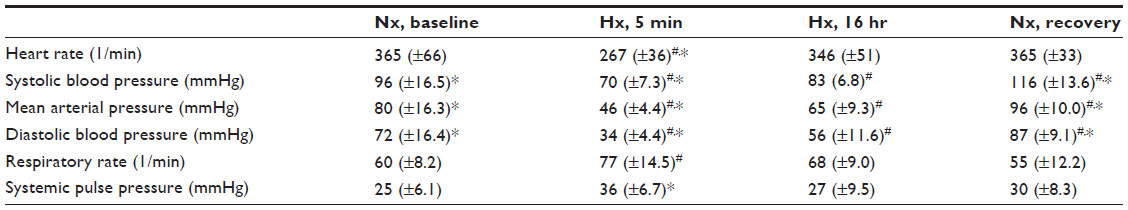 | Table 1 Systemic hemodynamics |
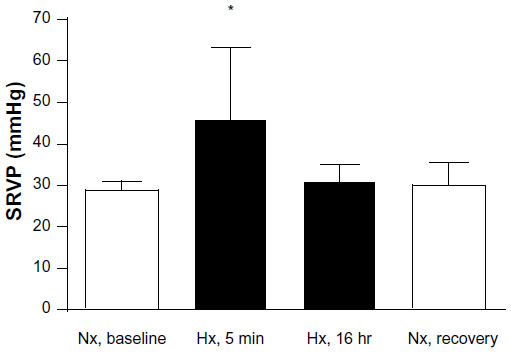 | Figure 4 Systolic right ventricular pressure (SRVP) measured by right heart catheterization. Two separate experiments were performed, in which rats were exposed to 16 hours of ambient room air (baseline) followed by an acute hypoxic phase (5 minutes) or 16 hours of hypoxia followed by a normoxic recovery phase. *P<0.05, n=7. |
Arterial blood gas analysis
The results of arterial blood gas analysis are shown in Table 2. The decrease in oxygen availability was paralleled by a persistently low arterial oxygen concentration (paO2). However, with normalization of the ambient oxygen concentration, paO2 normalized immediately. The evident hyperventilation resulted in low arterial concentrations of CO2 during the hypoxic episode. Of note, pCO2 remained low despite normalization of the inspiratory oxygen content. In addition, hypoxia led to an increase in lactate levels and metabolic acidosis.
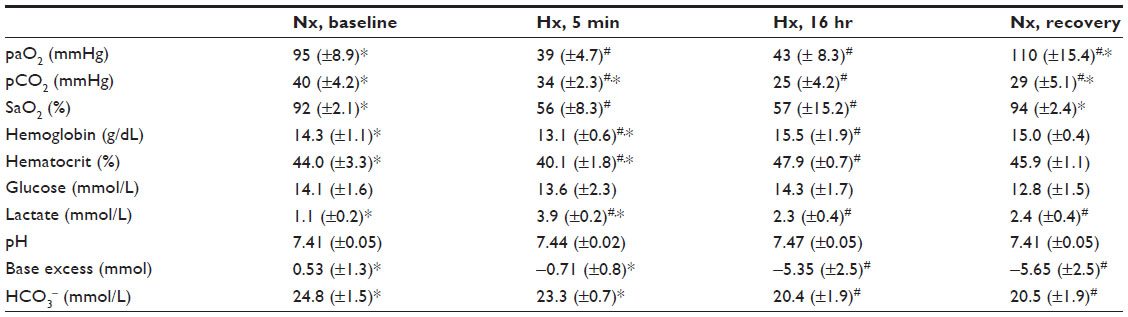 | Table 2 Arterial blood gas analysis |
No evidence of pulmonary edema in hypoxic lungs
Histological examination of rat lungs stained with hematoxylin and eosin did not reveal formation of edema (data not shown). An increase in the wet lung to body weight ratio from baseline to 8 hours of hypoxic exposure was observed (P<0.05), and this was further augmented after 16–48 hours. However, the lung dry to wet weight ratio at 16 hours of hypoxia was similar to that in normoxic control animals (Figure 5). In addition, no changes in right ventricular mass were detected (data not shown).
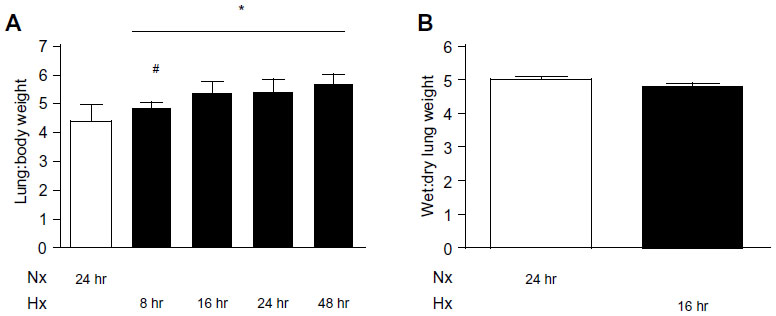 | Figure 5 Fluid accumulation in the lungs was assessed by two approaches. (A) The wet lung to body weight ratio was calculated after 8, 16, 24, and 48 hours of hypoxia (*P<0.05). #P<0.05 for difference between 8 hours and 16 hours of hypoxia). (B) The wet to dry lung ratio was measured at baseline and after 16 hours of hypoxia, n=6. |
No increase in constituents of bronchoalveolar lavage fluid
Total protein concentration, albumin content, and number of cells was measured in the bronchoalveolar lavage fluid of hypoxic lungs and normoxic lungs (Figure 6). We observed no change in the amount of total protein (data not shown), whereas a decrease in albumin was observed after hypoxia (7,253±1,151 μg/μL and 4,647±431 μg/μL, normoxic and hypoxic values, respectively; P=0.049). Further, the number of cells in the extracted fluid was slightly reduced, although this was not significant.
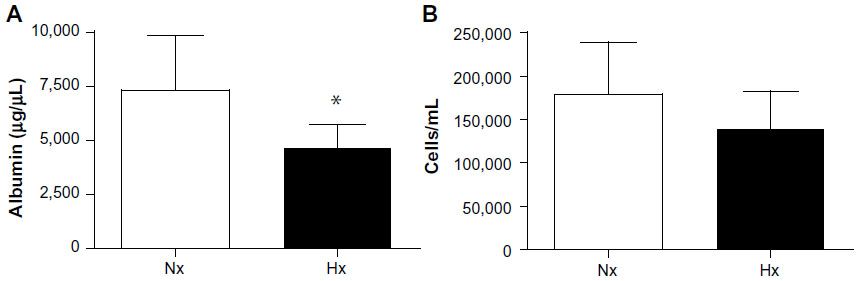 | Figure 6 Constituents of bronchoalveolar lung fluid, with quantification of albumin and cells in BALF isolated from control animals and animals exposed to 16 hours of hypoxia. (A) Albumin content (μg/μL). (B) Total cell number (per mL). (*P<0.05). |
Changes in copeptin and mid-regional proANP plasma levels
Plasma levels of copeptin were measured under control (normoxic) conditions and after acute exposure to 10% oxygen (5 minutes), which caused an almost seven-fold increase (Figure 7). After 16 hours of hypoxia, the values had returned to baseline, and no further modification was observed when switching acutely to normoxia (5 minutes) or hyperoxia (10 minutes). When the animal was re-exposed to hypoxia for 5 and 10 minutes, the initial increase in copeptin was reproduced. On the other hand, mid-regional proANP exhibited a small increase upon acute (5 minutes) hypoxic exposure, which was further augmented after 16 hours of hypoxia. This increase was attenuated gradually upon return to normoxic conditions, resulting in baseline values after one hour. Exposure to hyperoxia had no effect, nor did repeated exposure to acute hypoxia (5 and 10 minutes).
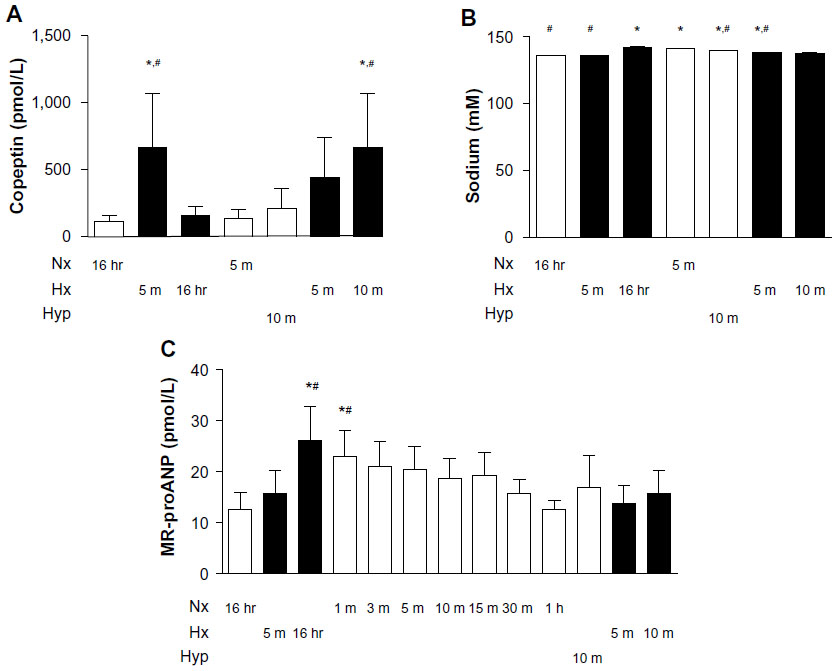 | Figure 7 Regulation of plasma copeptin and mid-regional proANP levels in response to hypoxia. Two separate experiments were performed, in which rats were exposed to 16 hours of ambient room air (baseline) followed by an acute hypoxic phase (5 minutes) or 16 hours of hypoxia followed by a normoxic recovery phase (5 minutes), 10 minutes of hyperoxia (100% oxygen), or repeated exposure to hypoxia for 5 and 10 minutes. (A) Plasma copeptin (pmol/L). (B) Plasma sodium (mM). (C) Plasma mid-regional proANP (pmol/L). *P<0.05 versus normoxia (baseline); #P<0.05 versus repeated acute hypoxia (5 minutes), n=5. |
Discussion
Here, we present evidence that acute (5 minutes) hypoxia leads to profound physiological changes in vivo, which are paralleled by a strong increase in copeptin levels, indicating activation of the AVP system. Despite ongoing exposure to hypoxia (10% ambient oxygen, 16 hours), the rats eventually recovered and resumed their normal activities, albeit to a somewhat lesser degree. Recovery was mirrored by a normalization of plasma copeptin levels.
A consistent reduction in body weight over time was observed in hypoxic rats. This result can be explained by the decreased fluid and food intake in the first hours after the onset of hypoxia. In addition, fluid loss was most likely aggravated by increased water vapor loss due to hyperventilation. The degree of intravascular fluid deficit was mirrored by an increase in hematocrit measured at 16 hours of hypoxia, as this hemoconcentration is most likely not a result of increased hematopoiesis at this early time point.
As the animals adapted to hypoxic exposure, ongoing cellular hypoxia was verified by investigating stabilization of the oxygen-sensitive transcription factor, HIF-1α. This transcription factor was confirmed in liver homogenates from all hypoxic animals, whereas only very low levels were observed in normoxic animals. We therefore conclude that the exposure of the rats to 10% oxygen did in fact result in tissue and cellular hypoxia at 16 hours. This conclusion was further supported by an increase in lactate levels and severe metabolic acidosis; the persistent hyperventilation despite normalization of the ambient oxygen concentration most likely represents an effort to compensate for these issues. Notably, the animals appeared to be unperturbed despite these severe metabolic disturbances.
Acute (5 minutes) hypoxia induced significant systemic hypotension, which was partially normalized after 16 hours. The systemic diastolic blood pressure decreased even more than the systolic pressure. This observation can be explained by hypoxia-induced vasodilatation.16 The fact that the pulse pressure was higher in hypoxic animals suggests that stroke volume was maintained, if not increased, in hypoxic rats, and a low left ventricular afterload might have contributed to this phenomenon. An increase in stroke volume might at least partially explain the significant drop in heart rate observed during acute (5 minutes) hypoxia. Another explanation might be the activation of an autonomic reflex in response to severe hypoxia, as can be found in patients with asphyxia.17 Future investigations, including blood flow measurements, are needed to resolve this intriguing finding of transient hypoxia-induced bradycardia.
As expected, we observed an acute hypoxic vasoconstrictive response in the pulmonary circulation after 5 minutes of breathing 10% oxygen, resulting in an elevated systolic right ventricular pressure. When measuring the same parameter again after 16 hours, pressures had returned to those observed with normoxia. Given that ANP was increased with hypoxia, it is likely that this hormone is involved in adaptation or normalization of the pulmonary arterial pressure after prolonged exposure to hypoxia. It has previously been reported that ANP has an effect on subacute but not acute hypoxic exposures18 and that ANP levels are only slightly elevated after short exposures to hypoxia,19 which is in agreement with our findings.
We measured the plasma levels of the AVP surrogate marker copeptin to determine the hypoxia-specific neuroendocrine stress response. It is well established that hyperosmolarity causes an approximately 5-fold increase in plasma copeptin concentrations,20 whereas acute cardiovascular disease and sepsis augment plasma copeptin concentrations up to 20-fold.21 The strongest copeptin increase has been found at birth in naturally delivered newborns,22 which is in agreement with our data, as contractions during delivery cause brief acute fetal hypoxia/ischemia. Thus far, only one study has investigated plasma copeptin in vivo by applying an infant ventilation model in Wistar rats. Copeptin was reported to be increased by 10-fold in response to hypoxemia and other stressful conditions.23 In the study presented here, we aimed to closely examine the acute versus prolonged AVP/copeptin response to hypoxia in the context of hemodynamic changes. AVP triggers adaptive responses in the kidney, vasculature, and other organs. For example, AVP mediates acute hypoxia-induced antidiuresis as investigated in dogs.11 Of note, AVP released upon acute hypoxia has been suggested to affect the kidney and lungs in llama fetuses (more so than those in sheep fetuses).24 Our data indicate that it is the acute decrease in paO2 causing AVP/copeptin release. However, we cannot exclude the possibility that, instead of a direct effect of hypoxia signaling on AVP/copeptin release which may integrate the autonomic nervous system,25 an indirect mechanism may be involved. Based on our own data (Figure 4) and those published previously,26 acute hypoxia results in a sudden drop of systolic blood pressure in rodents. Acute arterial hypotension is a well known trigger of AVP/copeptin release, for which reason both possible links between acute hypoxia and AVP/copeptin release, direct or indirect, might be involved.
As noted above, prolonged (16 hours) hypoxia did lead to a reduction in body weight but not to a significant increase in sodium levels or copeptin levels as shown in Figure 7. Hence, it can be concluded that dehydration, as a known trigger of AVP/copeptin release,20 was not present after 16 hours of hypoxia. In addition, the rats showed clinical signs of anorexia in the first hours after the onset of hypoxia, including decreased fluid and food intake. It has been suggested that anorexia impairs osmoregulation of AVP27 and may affect copeptin levels after 16 hours of hypoxia, but it is unlikely that it affects copeptin levels within the very short time of 5 minutes of hypoxia.
There are several indications that hypoxia-induced pulmonary edema did not develop in our animal model. First, arterial oxygen content did not progressively worsen with a longer duration of hypoxia. Second, arterial oxygen tension was normalized immediately when the animals were breathing room air again. Third, lung weights did not increase significantly when corrected for body weight. Fourth, no edema fluid was detectable with light histology. Fifth, no increase in albumin concentrations or cell counts was observed in fluids isolated from bronchoalveolar lavage. Together, our results are in contrast with previous papers demonstrating hypoxia-induced pulmonary edema in rats.28,29 This discrepancy might be explained by the different genetic backgrounds of the research animals used. Other potential explanations include use of normobaric hypoxia instead of hypobaric normoxia30–32 and the lack of physical exercise in our animals.33 More research is needed to resolve these conflicting results.
Limitations of the study
We limited our mechanistic studies of prolonged hypoxia to the time point of 16 hours, because our observations in a pilot study suggested that there were no significant pathophysiological changes beyond this time point. Clearly, a much longer duration of hypoxia (eg, several weeks) might have revealed additional findings; however, the effects of chronic hypoxia were outside the scope of this study. Kelestimur et al34 showed that plasma AVP values gradually increased after 4 weeks of hypoxia. This finding could indicate a biphasic response, although it should be noted that the reported increase is significantly lower than what we observed in the acute phase. Another important point is the fact that the hypoxic exposure was intermittent, because the cages were opened every other day. This intermittent exposure would also add cumulative stress to the animals.
Conclusion and clinical perspectives
Acute (5 minutes) hypoxia led to profound physiological changes, paralleled by a strong increase in copeptin levels. Despite ongoing exposure to 10% oxygen, the animals eventually recovered. This recovery was paralleled by normalization of plasma copeptin levels. Hence, plasma copeptin is a strong and sensitive marker of acute exposure to severe hypoxia, and at the same time, lack of induction indicates recovery. Copeptin can therefore reflect the ability of the organism to adapt to severe hypoxia.
Acknowledgments
LO, AR, BB, MM, and MG were supported by a grant from the Zürich Center for Integrative Human Physiology, University of Zürich, Zürich, Switzerland. SW was supported by a Swiss National Science Foundation Career Award for Medical Scientists (33CM30-124101).
Author contributions
LO conceived and designed the study, performed experiments, analyzed and interpreted data, and drafted and approved the manuscript; AR conceived and designed the study, performed animal experiments, analyzed and interpreted data, and drafted and approved the manuscript; SW performed laboratory experiments, analyzed and interpreted data, and drafted and approved the manuscript; EG performed experimental work and revised the manuscript critically and approved it; BB-S conceived and designed the study, interpreted data, and drafted and approved the manuscript; JS performed experimental work and revised the manuscript critically and approved it; MM conceived and designed the study, interpreted data, supervised the study, and drafted and approved the manuscript; and MG conceived of and designed the study, interpreted data, supervised the study, and drafted and approved the manuscript.
Disclosure
The authors report no conflicts of interest in this work.
References
Wheaton WW, Chandel NS. Hypoxia. 2. Hypoxia regulates cellular metabolism. Am J Physiol Cell Physiol. 2011;300(3):C385–C393. | |
Powell FL, Fu Z. HIF-1 and ventilatory acclimatization to chronic hypoxia. Respir Physiol Neurobiol. 2008;164(1–2):282–287. | |
Gorr TA, Wichmann D, Hu J, et al. Hypoxia tolerance in animals: biology and application. Physiol Biochem Zool. 2010;83(5):733–752. | |
Hermes-Lima M, Zenteno-Savin T. Animal response to drastic changes in oxygen availability and physiological oxidative stress. Comp Biochem Physiol C Toxicol Pharmacol. 2002;133(4):537–556. | |
Lopez-Barneo J, Nurse CA, Nilsson GE, Buck LT, Gassmann M, Bogdanova AY. First aid kit for hypoxic survival: sensors and strategies. Physiol Biochem Zool. 2010;83(5):753–763. | |
Dumas JP, Bardou M, Goirand F, Dumas M. Hypoxic pulmonary vasoconstriction. Gen Pharmacol. 1999;33(4):289–297. | |
Maggiorini M. High altitude-induced pulmonary oedema. Cardiovasc Res. 2006;72(1):41–50. | |
Jin HK, Yang RH, Thornton RM, Chen YF, Jackson R, Oparil S. Atrial natriuretic peptide lowers pulmonary arterial pressure in hypoxia-adapted rats. J Appl Physiol Respir Environ Exerc Physiol. 1988;65(4):1729–1735. | |
Anderson RJ, Pluss RG, Berns AS, et al. Mechanism of effect of hypoxia on renal water excretion. J Clin Invest. 1978;62(4):769–777. | |
Robillard JE, Weitzman RE, Burmeister L, Smith FG Jr. Developmental aspects of the renal response to hypoxemia in the lamb fetus. Circ Res. 1981;48(1):128–138. | |
Rose CE Jr, Godine RL Jr, Rose KY, Anderson RJ, Carey RM. Role of arginine vasopressin and angiotensin II in cardiovascular responses to combined acute hypoxemia and hypercapnic acidosis in conscious dogs. J Clin Invest. 1984;74(2):321–331. | |
Leffler CW, Busija DW, Brooks DP, et al. Vasopressin responses to asphyxia and hemorrhage in newborn pigs. Am J Physiol. 1987; 252(1 Pt 2):R122–R126. | |
Raff H, Kane CW, Wood CE. Arginine vasopressin responses to hypoxia and hypercapnia in late-gestation fetal sheep. Am J Physiol. 1991; 260(6 Pt 2):R1077–R1081. | |
Morgenthaler NG, Struck J, Alonso C, Bergmann A. Assay for the measurement of copeptin, a stable peptide derived from the precursor of vasopressin. Clin Chem. 2006;52(1):112–119. | |
Hopfl G, Ogunshola O, Gassmann M. Hypoxia and high altitude. The molecular response. Adv Exp Med Biol. 2003;543:89–115. | |
Dyson A, Stidwill R, Taylor V, Singer M. The impact of inspired oxygen concentration on tissue oxygenation during progressive haemorrhage. Intensive Care Med. 2009;35(10):1783–1791. | |
Gooden BA. The evolution of asphyxial defense. Integr Physiol Behav Sci. 1993;28(4):317–330. | |
Jin H, Yang RH, Chen YF, et al. Atrial natriuretic peptide in acute hypoxia-induced pulmonary hypertension in rats. J Appl Physiol Respir Environ Exerc Physiol. 1991;71(3):807–814. | |
Kawashima A, Kubo K, Hirai K, Yoshikawa S, Matsuzawa Y, Kobayashi T. Plasma levels of atrial natriuretic peptide under acute hypoxia in normal subjects. Respir Physiol. 1989;76(1):79–91. | |
Balanescu S, Kopp P, Gaskill MB, Morgenthaler NG, Schindler C, Rutishauser J. Correlation of plasma copeptin and vasopressin concentrations in hypo-, iso-, and hyperosmolar states. J Clin Endocrinol Metab. 2011;96(4):1046–1052. | |
Katan M, Christ-Crain M. The stress hormone copeptin: a new prognostic biomarker in acute illness. Swiss Med Wkly. 2010;140:w13101. | |
Wellmann S, Benzing J, Cippa G, et al. High copeptin concentrations in umbilical cord blood after vaginal delivery and birth acidosis. J Clin Endocrinol Metab. 2010;95(11):5091–5096. | |
L’Abate P, Wiegert S, Struck J, Wellmann S, Cannizzaro V. Determinants of plasma copeptin: a systematic investigation in a pediatric mechanical ventilation model. Respir Physiol Neurobiol. 2013;185(2):222–227. | |
Llanos AJ, Riquelme RA, Sanhueza EM, et al. The fetal llama versus the fetal sheep: different strategies to withstand hypoxia. High Alt Med Biol. 2003;4(2):193–202. | |
Brown CH, Ghamari-Langroudi M, Leng G, Bourque CW. Kappa-opioid receptor activation inhibits post-spike depolarizing after-potentials in rat supraoptic nucleus neurones in vitro. J Neuroendocrinol. 1999;11(11):825–828. | |
Matsuoka T, Dotta A, Mortola JP. Metabolic response to ambient temperature and hypoxia in sinoaortic-denervated rats. Am J Physiol. 1994;266(2 Pt 2):R387–R391. | |
Kanbur N, Katzman DK. Impaired osmoregulation in anorexia nervosa: review of the literature. Pediatr Endocrinol Rev. 2011;8(3):218–221. | |
Stelzner TJ, O’Brien RF, Sato K, Weil JV. Hypoxia-induced increases in pulmonary transvascular protein escape in rats. Modulation by glucocorticoids. J Clin Invest. 1988;82(6):1840–1847. | |
West JB, Colice GL, Lee YJ, et al. Pathogenesis of high-altitude pulmonary oedema: direct evidence of stress failure of pulmonary capillaries. Eur Respir J. 1995;8(4):523–529. | |
Sarada S, Himadri P, Mishra C, Geetali P, Ram MS, Ilavazhagan G. Role of oxidative stress and NFkB in hypoxia-induced pulmonary edema. Exp Biol Med (Maywood). 2008;233(9):1088–1098. | |
Shukla D, Saxena S, Purushothaman J, et al. Hypoxic preconditioning with cobalt ameliorates hypobaric hypoxia induced pulmonary edema in rat. Eur J Pharmacol. 2011;656(1–3):101–109. | |
Urano T, Kuwahira I, Iwamoto T, et al. Exposure to hypoxia results in uneven pulmonary blood flow distribution prior to pulmonary edema. Tokai J Exp Clin Med. 2005;30(4):193–202. | |
Bai C, She J, Goolaerts A, et al. Stress failure plays a major role in the development of high-altitude pulmonary oedema in rats. Eur Respir J. 2010;35(3):584–591. | |
Kelestimur H, Leach RM, Ward JP, Forsling ML. Vasopressin and oxytocin release during prolonged environmental hypoxia in the rat. Thorax. 1997;52(1):84–88. |
 © 2014 The Author(s). This work is published and licensed by Dove Medical Press Limited. The full terms of this license are available at https://www.dovepress.com/terms.php and incorporate the Creative Commons Attribution - Non Commercial (unported, v3.0) License.
By accessing the work you hereby accept the Terms. Non-commercial uses of the work are permitted without any further permission from Dove Medical Press Limited, provided the work is properly attributed. For permission for commercial use of this work, please see paragraphs 4.2 and 5 of our Terms.
© 2014 The Author(s). This work is published and licensed by Dove Medical Press Limited. The full terms of this license are available at https://www.dovepress.com/terms.php and incorporate the Creative Commons Attribution - Non Commercial (unported, v3.0) License.
By accessing the work you hereby accept the Terms. Non-commercial uses of the work are permitted without any further permission from Dove Medical Press Limited, provided the work is properly attributed. For permission for commercial use of this work, please see paragraphs 4.2 and 5 of our Terms.