")
Back to Journals » OncoTargets and Therapy » Volume 7
Antiangiogenic cancer drug sunitinib exhibits unexpected proangiogenic effects on endothelial cells
Authors Norton K, Han Z, Popel A, Pandey N
Received 28 March 2014
Accepted for publication 9 June 2014
Published 9 September 2014 Volume 2014:7 Pages 1571—1582
DOI https://doi.org/10.2147/OTT.S65055
Checked for plagiarism Yes
Review by Single anonymous peer review
Peer reviewer comments 2
Kerri-Ann Norton,1 Zheyi Han,1 Aleksander S Popel,1,2 Niranjan B Pandey1
1Department of Biomedical Engineering, 2Department of Oncology and the Sidney Kimmel Comprehensive Cancer Center, School of Medicine, Johns Hopkins University, Baltimore, MD, USA
Abstract: Angiogenesis, the formation of new blood vessels, is an essential step for cancer progression, but antiangiogenic therapies have shown limited success. Therefore, a better understanding of the effects of antiangiogenic treatments on endothelial cells is necessary. In this study, we evaluate the changes in cell surface vascular endothelial growth factor receptor (VEGFR) expression on endothelial cells in culture treated with the antiangiogenic tyrosine kinase inhibitor drug sunitinib, using quantitative flow cytometry. We find that proangiogenic VEGFR2 cell surface receptor numbers are increased with sunitinib treatment. This proangiogenic effect might account for the limited effects of sunitinib as a cancer therapy. We also find that this increase is inhibited by brefeldin A, an inhibitor of protein transport from the endoplasmic reticulum to the Golgi apparatus. The complex dynamics of cell surface VEGFRs may be important for successful treatment of cancer with antiangiogenic therapeutics.
Keywords: flow cytometry, VEGFRs, sunitinib, angiogenesis, VEGFA
Introduction
In the 1970s, Judah Folkman proposed the hypothesis that the formation of new blood vessels (angiogenesis) was a critical factor in tumor progression,1,2 and angiogenesis has since been recognized as a hallmark of cancer.3 One of the primary factors driving angiogenesis is vascular endothelial growth factor A (VEGFA).4 VEGFA binds to tyrosine kinase receptors on vascular endothelial cells (VEGFR1 and VEGFR2).5 These receptors affect angiogenesis and cancer in different ways: activation of VEGFR2 stimulates proliferation and migration of endothelial cells,6 whereas VEGFR1 stimulation enhances endothelial cell migration7 and has also been shown to have antiangiogenic effects.8 The VEGF pathways have also been shown to directly affect cancer cells, as many cancer cells express VEGFRs.9,10 In solid cancers, VEGFR2 activation causes cell proliferation and migration, and VEGFR1 has been shown to contribute to drug resistance in cancer cell lines.7 In light of this evidence, it was hypothesized that targeting the VEGF pathway would have anticancer effects.
Although angiogenesis is a valid therapeutic target in many types of cancer, antiangiogenic therapies have shown mixed success, including issues of having no effect on overall survival of breast cancer patients,11 drug resistance,12 increasing the number of cancer stem cells,13 and causing a more metastatic phenotype.11,14 Tyrosine kinase inhibitors (TKIs) such as sorafenib, pazopanib, and sunitinib; histone deacetylase inhibitors such as vorinostat; monoclonal antibodies to VEGF and VEGFR such as bevacizumab and ramucirumab; and a fusion receptor molecule, aflibercept, have been approved for cancer therapy.6,15,16 Antiangiogenic therapy has been shown to play a role in enhancing drug delivery to the tumor site by normalizing the vasculature.17 Indeed, several solid tumors have shown increased response when antiangiogenic therapies were given in combination with chemotherapy.18 Jain et al have been investigating potential biomarkers of response to antiangiogenic therapy, such as circulating VEGFR1 and stromal cell-derived factor 1 alpha (SDF1α).19,20 Thus, a better understanding of how and when antiangiogenic therapies will be successful is needed.
Sunitinib is an inhibitor of VEGFR1, VEGFR2, VEGFR3, platelet-derived growth factor receptor β (PDGFR-β), and rearranged during transfection (RET).21 Sunitinib was approved by the US Food and Drug Administration in 2006 for gastrointestinal stromal cancer,22 and in 2007 for advanced renal cell carcinoma.23 Here, we seek to understand its effect on the cell surface density of the VEGFRs. Other TKIs have overlapping targets with sunitinib: sorafenib targets VEGFR2, VEGFR3, and PDGFR, and pazopanib targets VEGFR1, VEGFR2, VEGFR3, and PDGFR.6 Sorafenib was approved by the US Food and Drug Administration for advanced renal cell carcinoma and hepatocellular carcinoma,6 and pazopanib was approved in 2009 for advanced renal cell carcinoma.6 The VEGFR dynamics could serve as a potential biomarker or lead to the discovery of potential biomarkers.
Although we know that antiangiogenic drugs such as sunitinib affect endothelial cell migration and proliferation, its mechanism of action is not completely understood. Computational models can predict the dynamics of free and bound VEGF in vivo, but the current models assume that the number of cell surface receptors remains constant;24–28 thus, the models are limited in their predictions of antiangiogenic therapy. Previous studies have been effective at measuring the numbers of VEGFRs in vitro29 and in vivo.30,31 Although the changes in VEGFRs have been investigated under ischemia,32 to our knowledge, the changes in surface receptors after antiangiogenic treatment have not been studied. Therefore, we investigate the changes in the number of VEGFR2 molecules on the endothelial cell surface after antiangiogenic treatment to better understand the cellular response to treatment.
Materials and methods
Cell treatment
HUVEC (human umbilical vein endothelial cells), MEC (microvascular endothelial cells), and bEnd-3 (immortalized mouse brain endothelial cells) were used in the study. HUVEC and MEC were purchased from Lonza (Walkersville, MD, USA) and grown in the recommended media: HUVEC in Endothelial Cell Growth Medium-2 (Endothelial Basal Medium-2 supplemented with the SingleQuot reagents) and MEC in Endothelial Cell Growth Medium-2-Microvascular (Endothelial Basal Medium-2-Microvascular with the SingleQuot reagents). bEnd-3 were purchased from American Type Culture Collection (Manassas, VA, USA) and grown in complete growth media Dulbecco’s Modified Eagle’s Medium with 10% fetal bovine serum. Endothelial cells were treated with sunitinib; in some experiments, the cells were also treated with VEGFA after washing out the sunitinib. Sunitinib was purchased from Sigma-Aldrich Co (St Louis, MO, USA), solubilized in 100% dimethyl sulfoxide (DMSO) at 1 mM and diluted to a working concentration of 40 μM in 5% DMSO/H2O. Vehicle control was 5% DMSO/H2O. VEGFA was used at a final concentration of 20 ng/mL. In experiments in which both VEGFA and the inhibitors were used, the cells were incubated with the inhibitors for 1.5 hours at 37°C before a VEGFA treatment for 10 minutes. The cells were incubated with each inhibitor for 1.5 hours in all experiments. In one set of experiments, brefeldin A (Sigma-Aldrich), an inhibitor of protein trafficking from the endoplasmic reticulum to the Golgi,33,34 was used to address the mechanism by which sunitinib was causing the increase in surface VEGFR2. For this experiment, cells were exposed to 1 μM brefeldin A for 1.5 hours before addition of 1 μM sunitinib for another 1.5 hours. The cells were then washed and processed for receptor quantification, as described here.
Cell collection and antibody binding
After the treatments, the cells were washed with 10 mL phosphate buffered saline, and 3 mL trypLE (Gibco 12604-013; Thermo Fisher Scientific, Waltham, MA, USA) was added to each flask to disassociate the cells from the flask. The activity of trypLE was stopped by adding 3 mL trypsin neutralization solution (Gibco R002100), which does not contain serum. The cells were counted after resuspension and collected by centrifugation. All cell pellets were resuspended in stain buffer (BD Biosciences, San Jose, CA, USA) at 4×10⁶ cells/mL or 105 cells/25 μL.
Of the cells in stain buffer, 25 μL were transferred to flow cytometry-compatible polystyrene round-bottom tubes (BD Biosciences 352008), and 10 μL allophycocyanin- or phycoerythrin (PE)-labeled antibodies (anti-human VEGFR1, VEGFR2, VEGFR3, PDGFR-β, Tie-2, or CD31 from R&D Systems, Inc., Minneapolis, MN, USA) were added to the appropriate tubes. The samples were incubated in the dark at 4°C for 45 minutes. Untreated cells (100 μL) were used as the no-antibody control.
Cell washing
After incubation was complete, 4 mL stain buffer was added to each of the tubes. All of the tubes were spun down in a Beckman Coulter Centrifuge at 1,400 rpm for 4 minutes at 4°C. The liquid was then poured out from each tube, and the process was repeated at least once. About 150 μL stain buffer was added to the pellets in each tube after the final wash.
Flow cytometry
The FACSCalibur flow cytometer (BD Biosciences) was used for all the experiments. Three graphs were created for evaluating the data and creating a gate for the cells. First, the cells from the no-antibody control were run through the cytometer, and the events were gated to remove debris from the analysis (Figure 1A); this gate was used for all other samples. For the no-antibody control sample, 3,500 events (cell receptor counts) were collected (Figure 1B). For each of the remaining samples, 3,500 events were collected (Figure 1C and D).
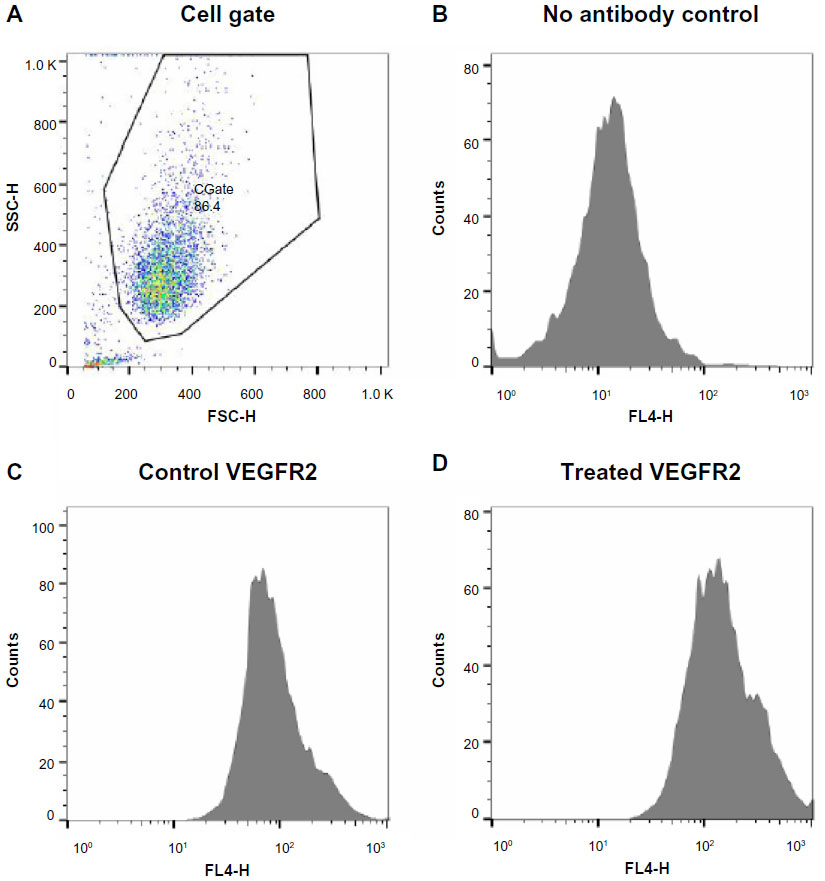 | Figure 1 Flow cytometry data. |
Data analysis
The data analysis was conducted in FlowJo and Excel. Dot plots for side scatter and forward scatter were created. A gate was chosen to remove nonviable cells and debris from the analysis, which was used for all the samples. For the cellular samples, the geometric means of values of the events within the gate were calculated. The geometric mean of the no-antibody control was subtracted from all of the sample geometric means to remove background noise. Although the geometric means of cell receptor counts calculated are quantitative, here we express changes in receptor numbers on treatment of cells relative to those of the untreated control.
Receptor quantification
In previous work from our laboratory, we quantified the actual number of receptors24,29–32 by using Quantibrite PE beads. Four populations of beads, each one loaded with a fixed number of PE molecules, allows the generation of a standard curve that can be used to estimate the number of receptors because the receptors are detected by antibodies also labeled with PE. Dot plots for side scatter and forward scatter for the beads were created, the population was gated, and a histogram of the FL2 data was created. For each of the four bead populations, a range of values was manually selected, and geometric means were calculated for each peak. Using the geometric means for each peak, linear regression was used to predict the equation of the line. We then used the equation to estimate the number of receptors, using rnum=10^(log[μg]+yi)/s, where rnum is the receptor number, μg is the geometric mean, yi is the y-intersect of the line, and s is the slope.
Relative receptor count
Although quantification was possible with some experiments, for experiments with sunitinib, this was not possible because sunitinib fluorescence overlaps with the fluorescence of the PE fluorophore, used in the Quantibrite beads. We used allophycocyanin for experiments with sunitinib, but Quantibrite beads labeled with allophycocyanin were not available from BD Biosciences, and so quantification was not possible. For this reason, we plot the relative receptor numbers in which the controls are normalized to 100 receptor counts.
Immunoblot analysis
After removing the growth media from a confluent monolayer of HUVEC and MEC growing on 10 cm2 dishes, 2 mL of growth media was added with either vehicle or 1 μM sunitinib. The cells were incubated in the presence of compound for 1.5 hours at 37°C. At that time, the cells were washed with ice-cold Dulbecco’s phosphate buffered saline and 500 μL cell lysis buffer (100 mM NaCl, 20 mM Tris-HCl at pH 8.0, 1% Triton, 100 μL/mL protease inhibitor cocktail [Sigma Aldrich], 10 μL/mL phosphatase inhibitor 2, and 10 μL/mL phosphatase inhibitor 3 [Sigma-Aldrich]) was added to each dish. The dishes were rocked on ice for 2 hours, at which point the cells were scraped, collected, and centrifuged. The pellet was discarded. Thirty microliters of lysate was separated by sodium dodecyl sulfate polyacrylamide gel electrophoresis, transferred to a nitrocellulose blot, and probed for VEGFR1 and VEGFR2 proteins (anti-VEGFR1 and anti-VEGFR2 antibodies from Cell Signaling Technology, Beverly, MA, USA) or phosphorylated VEGFR2 proteins (anti-p-VEGFR2 from Cell Signaling Technology) in an immunoblot assay.
Results
VEGFA treatment reduces the number of surface VEGFR2
In this article, we are interested in understanding the effects of (anti-)angiogenic signals on VEGFRs on the surface of endothelial cells. VEGFA is a known stimulator of angiogenesis, and after VEGFA binds to VEGFR2, signaling and concomitant internalization of the receptor occur, leading to a decrease in the number of receptors on the cell surface.35 To determine whether we could detect this decrease using our method, we treated HUVEC or MEC with VEGFA for 10 minutes and counted numbers of surface receptors using flow cytometry (Figure 2A and B). For this experiment in HUVEC, VEGFR1 was not reduced, whereas VEGFR2 was decreased (Figure 2A). In this experiment, in MEC, the numbers of VEGFR1 and VEGFR2 were both significantly decreased (P<0.01) on the surface of the cells on VEGFA treatment (Figure 2B). The experiment was repeated at least five times with replicates of two to establish significance. In both HUVEC and MEC, a statistically significant decrease in the number of surface VEGFR2 was observed. In MEC, VEGFR1 also showed a statistically significant decrease (data not shown).
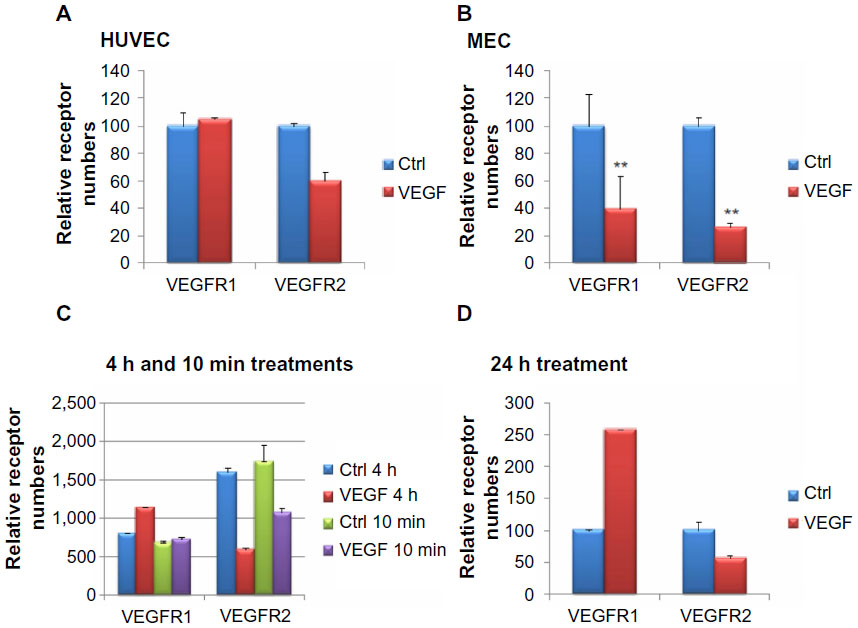 | Figure 2 Changes in surface vascular endothelial cell growth factor receptor 1 (VEGFR1) and VEGFR2 on vascular endothelial cell growth factor A (VEGFA) application, shown as percentage of control. |
In vivo VEGFA stimulation may occur over periods longer than 10 minutes, and thus we were interested in whether the length of time of exposure to VEGFA affected the response. To determine whether the response to VEGFA was time-dependent, we examined the levels of VEGFR1 and VEGFR2 on the surface of HUVEC, which were treated with VEGFA for 10 minutes, 4 hours (Figure 2C), or 24 hours (Figure 2D). Interestingly, we found that the number of VEGFR1 on the surface increased with increasing duration of VEGFA treatment (Figure 2C and D). With 10 minutes of VEGFA treatment, there was not much difference between the control and treated cells, but after a 4 hour treatment, the number of surface VEGFR1 increased by about 25%, and by 24 hours, the number of surface VEGFR1s was closer to three times that in untreated cells. Surface VEGFR2 levels were decreased at all three points. These trends, the increase of VEGFR1 and decrease of VEGFR2 during a 24 hour VEGFA treatment, are consistent with previous work.29
Quantification of cell surface VEGFRs
Surface VEGFR1 and VEGFR2 were measured in HUVEC and MEC and quantified (Figure 3). Quantification was done using calibration Quantibrite beads to determine actual receptor numbers per cell. Using the quantified receptor numbers, we can accurately compare receptor numbers across cell types and different receptors. In both HUVEC and MEC, surface VEGFR2 numbers are higher than surface VEGFR1, in HUVEC by around four-fold (Figure 3A) and in MEC by about 15-fold (Figure 3B). In addition, the numbers of VEGFR2 surface receptors in MEC are greater than in HUVEC by around ten-fold. Our results are consistent with previous work done in our laboratory, but there were receptor number variations, most likely because of differences in cell batches.29
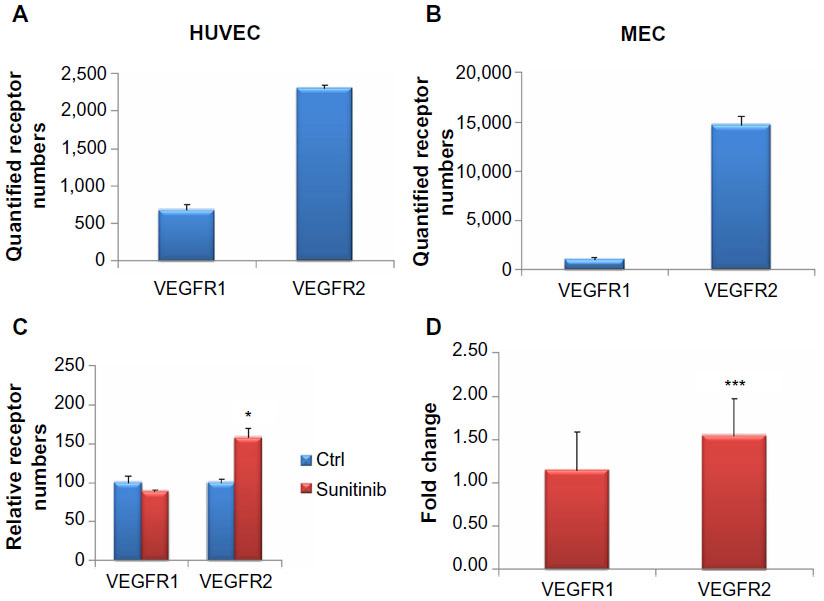 | Figure 3 Surface receptor numbers with and without sunitinib treatment. |
Sunitinib treatment increases the number of VEGFR2 on the cell surface
Because changes in the number of surface VEGFRs with the angiogenic factor VEGFA could be detected using our method, we were next interested in the effects of antiangiogenic compounds on surface receptors. We found that 1 μM sunitinib increased the mean surface expression of VEGFR2 on MEC by 1.58-fold (Figure 3C). Using a Mann–Whitney–Wilcoxon one-tailed test, we found this result to be statistically significant (P<0.05). In contrast, the levels of surface VEGFR1 were not increased by sunitinib treatment (Figure 3C). Thus, this effect of increased number of cell surface receptors on sunitinib treatment seems to be specific to VEGFR2.
Cell surface VEGFR1 by sunitinib treatment is not statistically higher than control
Next, we wanted to determine whether changes in surface VEGFR1 levels that occurred on sunitinib treatment would be statistically significant if we increased the sample size. Therefore, we combined the results of at least three separate experiments on MEC, each with triplicates, leading to an N>9. To account for possible differences in surface receptor numbers across experiments, we calculated the ratio of sunitinib over the control for each replicate to have a normalized comparison. We used a z-test to determine whether the ratio of sunitinib treated over control was statistically higher than 1 for VEGFR1 and VEGFR2 (Figure 3D). We found that the ratio of surface VEGFR2 on 1 μM sunitinib treatment over control was statistically higher than 1. In the same experiment, the ratio of sunitinib treated over control was not statistically different from 1 for VEGFR1. Because statistical significance did not change with the increased numbers of samples, we are confident in our sample numbers for significance.
Sunitinib treatment increases the number of VEGFR2 surface receptors on other endothelial cell lines
To determine whether the increase in VEGF2 surface receptors was limited to the dermal MEC endothelial cell line tested earlier, we tested HUVEC and bEnd-3 cell lines as well. In both HUVEC and bEnd-3, VEGFR2 was increased on the cell surface by sunitinib treatment (Figure 4A and B). The increase in the surface VEGFR2 levels in HUVEC cells (Figure 4A) and bEnd-3 (Figure 4B) was lower than in MEC. Using a Mann–Whitney–Wilcoxon one-tailed test, we found the HUVEC results were not statistically significant, in agreement with the results shown earlier, whereas the increase in surface VEGFR2 in bEnd-3 was significant. Therefore, we conclude that the changes in VEGFR2 are not limited to dermal endothelial cells.
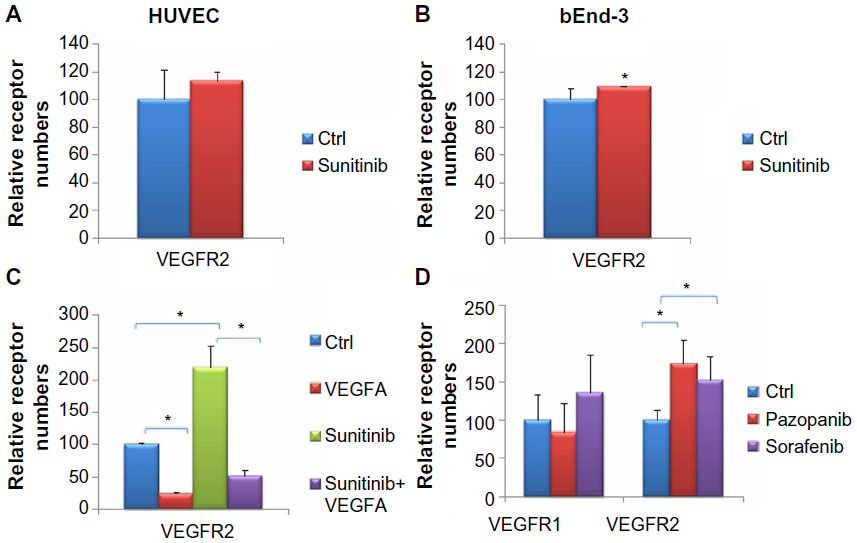 | Figure 4 The response of various vascular endothelial cell growth factor receptors in different cell lines and R tyrosine kinase inhibitor treatment. |
VEGFA treatment reduces the number of cell surface VEGFR2 on sunitinib treatment
Although our studies demonstrate that VEGFR2 increases on the cell surface upon sunitinib treatment, it is unclear whether these receptors are also active and can respond to stimuli. Because VEGFA reduces the number of surface VEGFR2 when applied alone, we wanted to test whether it would reduce the number of surface receptors after their numbers were increased by prior treatment with sunitinib. This would support the idea that the new VEGF2 surface receptors induced by sunitinib are indeed active. Therefore, we first treated the MEC with sunitinib or DMSO for 1.5 hours, followed by 10 minutes of VEGFA application to both groups with the sunitinib still present. Our results show that in both the control and sunitinib-treated groups, the mean number of VEGFR2 decreased significantly after VEGFA treatment (P=0.05; Figure 4C).
Other antiangiogenic drugs increase cell surface VEGFR2s similar to sunitinib
Other receptor tyrosine kinase inhibitors (RTKIs) with similar targets have been approved for renal cell carcinoma and hepatocellular carcinoma along with sunitinib, such as pazopanib and sorafenib. Therefore, it is plausible that these drugs would have similar effects on VEGFRs as sunitinib, and this might indicate common mechanisms of action. To investigate these effects, we treated MEC with 1 μM pazopanib or sorafenib and measured the numbers of surface VEGFR1 and VEGFR2 (Figure 4D). We found that similar to sunitinib, the mean numbers of surface VEGFR2 were significantly increased. The numbers of surface VEGFR1 were not significantly different on treatment with pazopanib and sorafenib.
Increase of cell surface VEGFR2 is dependent on sunitinib concentration
The increase in VEGFRs could vary depending on the concentration of sunitinib used, thus exhibiting a dose response. To examine this question, we treated MEC with varying concentrations of sunitinib (0.2, 1, and 5) and measured the numbers of receptors using flow cytometry. The numbers of surface VEGFR2 on cells treated with 0.2, 1, and 5 μM sunitinib were greater than the control (Figure 5A). We treated MEC with lower concentrations of sunitinib (0.04, 0.2, and 1 μM) and measured VEGFR2 surface receptors to further investigate the dose response. Using lower sunitinib concentrations, we found an increasing dose response with a plateauing effect at 0.2 μM (Figure 5B).
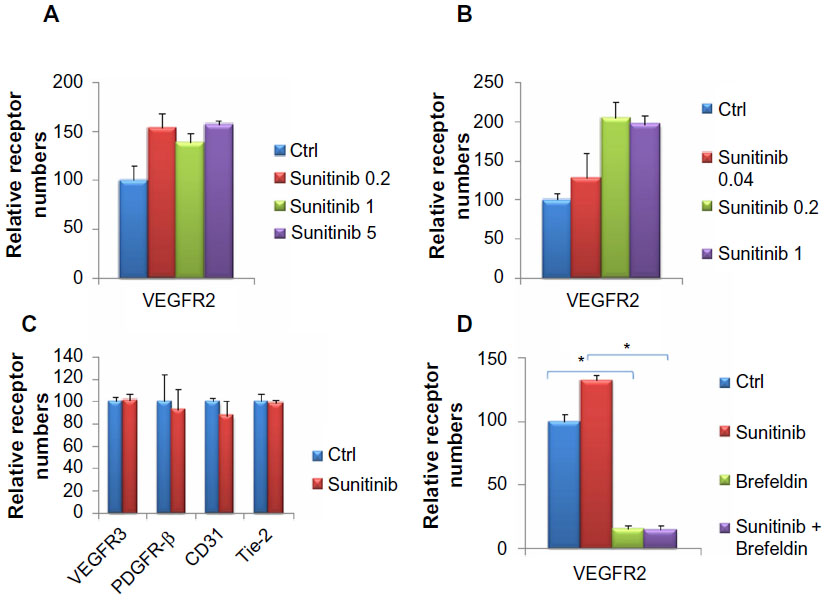 | Figure 5 Surface vascular endothelial cell growth factor receptor 1 (VEGFR1) and VEGFR2s increased differentially in response to changes in sunitinib concentration. |
Sunitinib has varying effects on other receptors
Because sunitinib had different outcomes on VEGFR 1 and 2, we wanted to investigate its effect on other angiogenic receptors. We treated MEC with sunitinib for 1.5 hours and investigated VEGFR3, PDGFR-β, CD31, and Tie-2 surface receptors (Figure 5C). We found that sunitinib treatment had little effect on the surface expression of VEGFR3 and PDGFR-β. Sunitinib lowered the number of surface Tie-2 and CD31 receptors (Figure 5C), but this effect was not significant. In conclusion, sunitinib had the greatest effect on VEGFR2 among the angiogenic receptors tested.
The protein trafficking inhibitor brefeldin A counteracts sunitinib- induced surface receptor VEGFR2
The increase in surface VEGFR2 may use normal mechanisms of protein transport used by other proteins transported to the surface. Brefeldin A is a lactone antibiotic produced by fungal organisms such as Eupenicillium brefeldianum, and it inhibits protein transport from the endoplasmic reticulum to the Golgi apparatus, resulting in an inhibition of net protein transport to the cell membrane.36,37 Brefeldin A caused a dramatic decrease in the surface VEGFR2 in MEC (Figure 5D). Although sunitinib enhanced the number of surface VEGFR2 in the absence of brefeldin A, VEGFR2 level was reduced to approximately the same number of receptors as the control in the presence of brefeldin A. These decreases in receptor levels are significant. In these experiments, brefeldin A was added before sunitinib, and both compounds were present simultaneously after that.
Sunitinib treatment caused a decrease in total VEGFR1 but a slight increase in total VEGFR2
One possible explanation for the increase in cell surface receptors is that the total amount of protein (ie, cell surface and intracellular) in the cell increases on sunitinib treatment. Although this is unlikely because of the fact that receptor changes on the cell surface occur quickly, it is important to rule this out as a possibility. To investigate this, we performed immunoblots on MEC and HUVEC after 1.5 hours of treatment with vehicle and 1 μM sunitinib (Figure 6A). Interestingly, total VEGFR1 decreased on sunitinib treatment (Figure 6B), whereas total VEGFR2 increased slightly in both HUVEC and MEC (Figure 6C). However, the slight increase in total VEGFR2 did not account for the increased surface levels in MEC on sunitinib treatment.
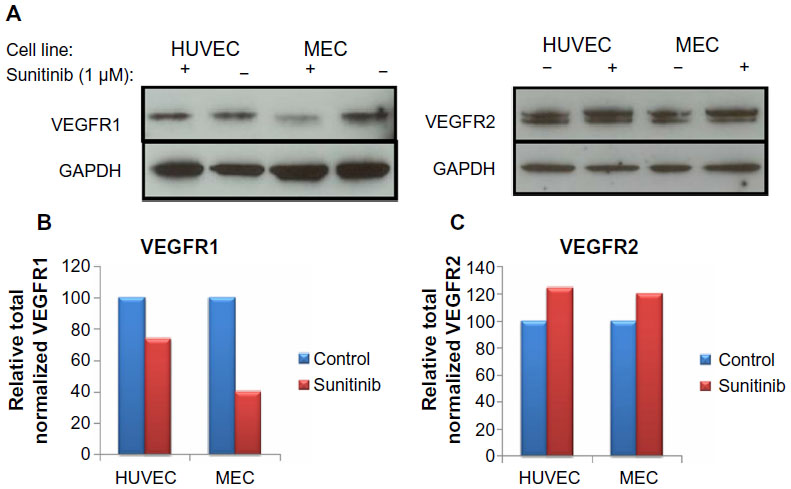 | Figure 6 Total vascular endothelial cell growth factor receptor 1 (VEGFR1) decreased and total VEGFR2 increased slightly on 1.5 hour sunitinib treatment. |
VEGFA induces phosphorylation of cell surface VEGFR2 after sunitinib treatment
To verify that the increased surface VEGFR2 after sunitinib treatment were indeed active, we measured pVEGFR2 in b-End3 that were treated with sunitinib or treated with VEGFA after first treating with sunitinib using immunoblots (Figure 7). We found that the amount of pVEGFR2 in cells first treated with sunitinib followed by VEGFA was higher than that in cells treated with sunitinib alone. This supports the fact that the increased surface VEGFR2 after sunitinib treatment are indeed active.
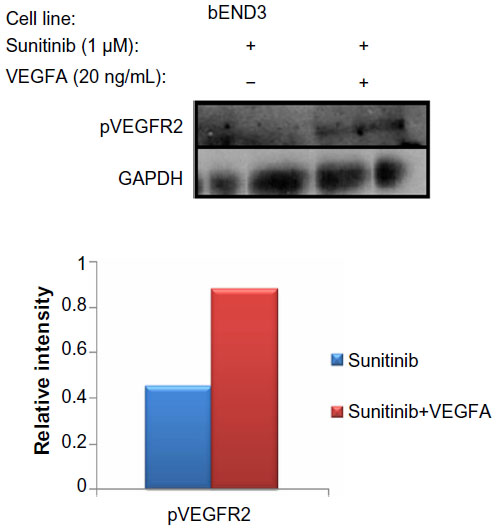 | Figure 7 Total phosphorylated vascular endothelial cell growth factor receptor 2 increased on VEGFA induction compared with sunitinib treatment alone. |
Discussion
We have used flow cytometry to understand the effects of the antiangiogenic drug sunitinib on VEGFRs on the endothelial cell surface. We find that sunitinib treatment caused proangiogenic VEGFR2 numbers on the cell surface to significantly increase in MEC and bEND-3 cells, but not in HUVEC. Tumors have microvascular endothelial cells that resemble MEC more closely than HUVEC. Our result that sunitinib increases the levels of surface VEGFR2 on microvascular endothelial cells could thus be very important for the antiangiogenic treatment of tumors. The effects of sunitinib were shown to be concentration-dependent, with the increases in cell surface receptor correlating with increasing drug concentration up to a maximum level. Interestingly, pazopanib and sorafenib, which are also RTKIs, cause an increase in the number of surface proangiogenic VEGFR2 on endothelial cells. We also find that this increase is a specific response and that other cell surface receptors (VEGFR1, VEGFR3, PDGFR-β, and Tie-2) are unaffected by sunitinib treatment.
Because VEGFR2 is known to stimulate angiogenesis,6 its increase on sunitinib treatment is surprising. Thus, we tried to understand the mechanism for this result. First, we wanted to investigate whether sunitinib treatment increased the total amount of receptors in the cell without changing the total receptor distribution. To investigate this, we measured the total amount of VEGFR2 by immunoblot. In both HUVEC and MEC, we found that total VEGFR2 increased slightly with a 1.5 hour sunitinib treatment, which could partially account for the increase in surface VEGFR2, but there is probably an increase in VEGFR2 shuttled to the surface of the cell as well. In contrast to this result, we found that the total amount of VEGFR1 decreased after sunitinib treatment for both HUVEC and MEC, whereas the number of surface receptors remained similar to control. This suggests that although total VEGFR1 goes down on sunitinib treatment, more of the receptors shuttle to the surface of the cell, so that the levels of surface VEGFR1 seen with or without sunitinib treatment are comparable. Taking both results into account, it appears that sunitinib increases the shuttling of both VEGFR1 and VEGFR2 to the surface of the cell.
Because the magnitude of the increase in the number of surface VEGFR2 could not be explained by an increase in total receptors alone, we wanted to investigate whether the distribution of the receptors changed. Brefeldin A is a known inhibitor of protein transport from the endoplasmic reticulum to the Golgi apparatus.33,34 If we first blocked receptor transport to the surface with brefeldin A and reduced the number of VEGFR2 on the cell surface, if sunitinib was able to increase the surface expression of these receptors, it must increase receptor externalization. Thus, we treated MEC with brefeldin A and then with either sunitinib or vehicle, without washing out the brefeldin A, and then measured the number of surface receptors. In agreement with our prediction, brefeldin A almost completely eliminated VEGFR2 from the cell surface when applied alone or together with sunitinib (Figure 6B). This result implies that sunitinib is not able to overcome the effects of brefeldin A by increasing receptor externalization.
Understanding the specific effects of sunitinib on endothelial cells is important because although it is antiangiogenic, it has also been found to increase metastasis more than other antiangiogenic treatments.38 Because sunitinib is antiangiogenic, it is unexpected that it increases the number of VEGFRs on the surface of the cell, and thus increases the potential angiogenic stimulation from the VEGFR2. It is possible, however, that the receptors that go to the plasma membrane on sunitinib treatment are not functional or have activities and properties that are subtly different from the normal receptors. One obvious type of difference could be changes in the phosphorylation of constitutively phosphorylated amino acids because of inhibition by a tyrosine kinase inhibitor. These differences may cause the newly transported receptors to signal in new ways or have novel interactions with the usual interacting partners or with other proteins. These new properties could lead to increased metastasis in unknown ways. Although there may be subtle differences in the newly transported receptors, as just discussed, these new receptors appear to be responsive to VEGFA. As shown in Figure 4C, VEGFA treatment after sunitinib treatment, which increases the number of surface VEGFR2, causes a dramatic decrease in the number of surface VEGFR2. In addition the new surface VEGFR2 can be phosphorylated on VEGFA treatment, just like normal VEGFR2, as shown in Figure 7. These two results strongly suggest that the sunitinib-mediated increase in the number of cell surface VEGFR2 that we report here are active and inducible by VEGFA. Sunitinib is taken once daily by patients. In between two doses, the levels of sunitinib decrease, but the levels of VEGFA secreted by the tumor persist. If the increased number of surface VEGFR2 persists when the concentration of sunitinib nears its trough, VEGFA could enhance angiogenesis, causing tumor growth.
Our work suggests that sunitinib most likely promotes the transport of VEGFR2 using the normal transport pathway for this receptor. The question of how it promotes that transport is not answered in this study. One possible mechanism is that the kinase-inhibiting activity of sunitinib is essential for VEGFR2 transport. Sunitinib is a “dirty” kinase inhibitor with off-target inhibitory effects on many kinases.39 It is possible that the VEGFR2 transport pathway is modulated by a kinase or a substrate of a kinase that is inhibited by sunitinib. We would postulate that this kinase or kinase substrate is an inhibitor of the pathway and that when it is inhibited by sunitinib, the efficiency of transport increases. In this study, we did not find any other receptor in amounts at the cell surface that were reproducibly increased by sunitinib; however, this was just a small subset of proteins, and it is possible that there is a class of receptor proteins all of which depend on the same sunitinib-responsive factor for transport to the cell surface. We did not study the other RTKIs in as much detail as sunitinib, but we would hypothesize a similar mechanism by which these agents increase the number of surface VEGFR2 on endothelial cells. In fact, a thorough analysis of the common kinases inhibited by all 3 RTKIs may help us narrow down the list of kinases that could be responsible for regulation of VEGFR2 transport under physiological conditions, as postulated earlier.
In conclusion, this study has examined the effects of VEGF surface receptor numbers after antiangiogenic treatment in vitro. We find an increase in VEGFR2 numbers with treatment, which might be a cellular response to the sunitinib treatment that activates the angiogenic pathway. Perhaps this response could be attenuated by coadministration of another agent or by a modified form of sunitinib. We would postulate that these changes would result in a better antiangiogenic therapeutic and perhaps a better cancer drug, as well as a lower probability of increase in metastasis.
Acknowledgments
This research is supported by National Institutes of Health grants R01 CA154738 and R01 CA138264 (to ASP), and by T32 CA130840 05 and a American Cancer Society postdoctoral fellowship (to K-AN). The authors thank Dr D Artemov, Dr Y Kato, Dr X Zhang, Dr PI Imoukhuede, and Dr J Koskimaki for critical discussions.
Disclosure
The authors report no conflicts of interest in this work.
References
Folkman J. Tumor angiogenesis: therapeutic implications. N Engl J Med. 1971;285(21):1182–1186. | |
Folkman J, Merler E, Abernathy C, Williams G. Isolation of a tumor factor responsible for angiogenesis. J Exp Med. 1971;133(2):275–288. | |
Hanahan D, Weinberg RA. Hallmarks of cancer: the next generation. Cell. 2011;144(5):646–674. | |
Claesson-Welsh L, Welsh M. VEGFA and tumour angiogenesis. J Intern Med. 2013;273(2):114–127. | |
Claesson-Welsh L. Signal transduction by vascular endothelial growth factor receptors. Biochem Soc Trans. 2003;31(Pt 1):20–24. | |
Tugues S, Koch S, Gualandi L, Li X, Claesson-Welsh L. Vascular endothelial growth factors and receptors: anti-angiogenic therapy in the treatment of cancer. Mol Aspects Med. 2011;32(2):88–111. | |
Bianco R, Rosa R, Damiano V, et al. Vascular endothelial growth factor receptor-1 contributes to resistance to anti-epidermal growth factor receptor drugs in human cancer cells. Clin Cancer Res. 2008;14(16):5069–5080. | |
Vempati P, Popel AS, Mac Gabhann F. Extracellular regulation of VEGF: isoforms, proteolysis, and vascular patterning. Cytokine Growth Factor Rev. 2014;25(1):1–19. | |
Büchler P, Reber HA, Büchler MW, Friess H, Hines OJ. VEGF-RII influences the prognosis of pancreatic cancer. Ann Surg. 2002;236(6):738–749, discussion 749. | |
Lee TH, Seng S, Sekine M, et al. Vascular endothelial growth factor mediates intracrine survival in human breast carcinoma cells through internally expressed VEGFR1/FLT1. PLoS Med. 2007; 4(6):e186. | |
Ebos JM, Kerbel RS. Antiangiogenic therapy: impact on invasion, disease progression, and metastasis. Nat Rev Clin Oncol. 2011;8(4):210–221. | |
Hida K, Akiyama K, Ohga N, Maishi N, Hida Y. Tumour endothelial cells acquire drug resistance in a tumour microenvironment. J Biochem. 2013;153(3):243–249. | |
Conley SJ, Gheordunescu E, Kakarala P, et al. Antiangiogenic agents increase breast cancer stem cells via the generation of tumor hypoxia. Proc Natl Acad Sci U S A. 2012;109(8):2784–2789. | |
Welti J, Loges S, Dimmeler S, Carmeliet P. Recent molecular discoveries in angiogenesis and antiangiogenic therapies in cancer. J Clin Invest. 2013;123(8):3190–3200. | |
Duda DG, Munn LL, Jain RK. Can we identify predictive biomarkers for antiangiogenic therapy of cancer using mathematical modeling? J Natl Cancer Inst. 2013;105(11):762–765. | |
Larsen AK, Ouaret D, El Ouadrani K, Petitprez A. Targeting EGFR and VEGF(R) pathway cross-talk in tumor survival and angiogenesis. Pharmacol Ther. 2011;131(1):80–90. | |
Kieda C, El Hafny-Rahbi B, Collet G, et al. Stable tumor vessel normalization with pO2 increase and endothelial PTEN activation by inositol trispyrophosphate brings novel tumor treatment. J Mol Med (Berl). 2013;91(7):883–899. | |
De Bock K, Cauwenberghs S, Carmeliet P. Vessel abnormalization: another hallmark of cancer? Molecular mechanisms and therapeutic implications. Curr Opin Genet Dev. 2011;21(1):73–79. | |
Jain RK, Duda DG, Willett CG, et al. Biomarkers of response and resistance to antiangiogenic therapy. Nat Rev Clin Oncol. 2009;6(6):327–338. | |
Jain RK. Normalizing tumor microenvironment to treat cancer: bench to bedside to biomarkers. J Clin Oncol. 2013;31(17):2205–2218. | |
Bhise NS, Shmueli RB, Sunshine JC, Tzeng SY, Green JJ. Drug delivery strategies for therapeutic angiogenesis and antiangiogenesis. Expert Opin Drug Deliv. 2011;8(4):485–504. | |
Demetri GD, van Oosterom AT, Garrett CR, et al. Efficacy and safety of sunitinib in patients with advanced gastrointestinal stromal tumour after failure of imatinib: a randomised controlled trial. Lancet. 2006;368(9544):1329–1338. | |
Motzer RJ, Hutson TE, Tomczak P, et al. Sunitinib versus interferon alfa in metastatic renal-cell carcinoma. N Engl J Med. 2007;356(2):115–124. | |
Finley SD, Engel-Stefanini MO, Imoukhuede PI, Popel AS. Pharmacokinetics and pharmacodynamics of VEGF-neutralizing antibodies. BMC Syst Biol. 2011;5(193). | |
Finley SD, Popel AS. Predicting the effects of anti-angiogenic agents targeting specific VEGF isoforms. AAPS J. 2012;14(3):500–509. | |
Finley SD, Dhar M, Popel AS. Compartment model predicts VEGF secretion and investigates the effects of VEGF trap in tumor-bearing mice. Front Oncol. 2013;3:(193). | |
Finley SD, Popel AS. Effect of tumor microenvironment on tumor VEGF during anti-VEGF treatment: systems biology predictions. J Natl Cancer Inst. 2013;105(11):802–811. | |
Yen P, Finley SD, Engel-Stefanini MO, Popel AS. A two-compartment model of VEGF distribution in the mouse. PLoS ONE. 2011;6(11):e27514. | |
Imoukhuede PI, Popel AS. Quantification and cell-to-cell variation of vascular endothelial growth factor receptors. Exp Cell Res. 2011;317(7):955–965. | |
Imoukhuede PI, Popel AS. Quantitative Fluorescent Profiling of VEGFRs Reveals Tumor Cell and Endothelial Cell Heterogeneity in Breast Cancer Xenografts. Cancer Medicine; 2014. | |
Imoukhuede PI, Popel AS. Expression of VEGF receptors on endothelial cells in mouse skeletal muscle. PLoS ONE. 2012;7(9):e44791. | |
Imoukhuede PI, Dokun AO, Annex BH, Popel AS. Endothelial cell-by-cell profiling reveals the temporal dynamics of VEGFR1 and VEGFR2 membrane localization after murine hindlimb ischemia. Am J Physiol Heart Circ Physiol. 2013;304(8):H1085–H1093. | |
Klausner RD, Donaldson JG, Lippincott-Schwartz J. Brefeldin A: insights into the control of membrane traffic and organelle structure. J Cell Biol. 1992;116(5):1071–1080. | |
Misumi Y, Misumi Y, Miki K, Takatsuki A, Tamura G, Ikehara Y. Novel blockade by brefeldin A of intracellular transport of secretory proteins in cultured rat hepatocytes. J Biol Chem. 1986;261(24):11398–11403. | |
Ewan LC, Jopling HM, Jia H, et al. Intrinsic tyrosine kinase activity is required for vascular endothelial growth factor receptor 2 ubiquitination, sorting and degradation in endothelial cells. Traffic. 2006;7(9):1270–1282. | |
Tamura G, Ando K, Suzuki S, Takatsuki A, Arima K. Antiviral activity of brefeldin A and verrucarin A. J Antibiot (Tokyo). 1968;21(2):160–161. | |
Tseng CN, Huang CF, Cho CL, et al. Brefeldin a effectively inhibits cancer stem cell-like properties and MMP-9 activity in human colorectal cancer Colo 205 cells. Molecules. 2013;18(9):10242–10253. | |
Chung AS, Kowanetz M, Wu X, et al. Differential drug class-specific metastatic effects following treatment with a panel of angiogenesis inhibitors. J Pathol. 2012;227(4):404–416. | |
Karaman MW, Herrgard S, Treiber DK, et al. A quantitative analysis of kinase inhibitor selectivity. Nat Biotechnol. 2008;26(1):127–132. |
 © 2014 The Author(s). This work is published and licensed by Dove Medical Press Limited. The full terms of this license are available at https://www.dovepress.com/terms.php and incorporate the Creative Commons Attribution - Non Commercial (unported, v3.0) License.
By accessing the work you hereby accept the Terms. Non-commercial uses of the work are permitted without any further permission from Dove Medical Press Limited, provided the work is properly attributed. For permission for commercial use of this work, please see paragraphs 4.2 and 5 of our Terms.
© 2014 The Author(s). This work is published and licensed by Dove Medical Press Limited. The full terms of this license are available at https://www.dovepress.com/terms.php and incorporate the Creative Commons Attribution - Non Commercial (unported, v3.0) License.
By accessing the work you hereby accept the Terms. Non-commercial uses of the work are permitted without any further permission from Dove Medical Press Limited, provided the work is properly attributed. For permission for commercial use of this work, please see paragraphs 4.2 and 5 of our Terms.