")
Back to Journals » Psychology Research and Behavior Management » Volume 11
An exploration of the association between matrix reasoning and eating disturbance behavior in girls with autism spectrum disorder
Authors Bitsika V , Sharpley CF
Received 20 February 2018
Accepted for publication 18 April 2018
Published 23 July 2018 Volume 2018:11 Pages 259—266
DOI https://doi.org/10.2147/PRBM.S166010
Checked for plagiarism Yes
Review by Single anonymous peer review
Peer reviewer comments 3
Editor who approved publication: Dr Igor Elman
Vicki Bitsika,1 Christopher F Sharpley2
1Centre for Autism Spectrum Disorder, Bond University, Robina, QLD, Australia; 2Brain-Behaviour Research Group, University of New England, Armidale, NSW, Australia
Background: Although there have been suggestions that central coherence may be associated with eating disturbances (EBD) in children with autism spectrum disorder (ASD), relatively little attention has been given to specific aspects of IQ and EDB.
Methods: The association between total IQ, perceptual and verbal composite scores and subtests was explored in a sample of 50 high-functioning girls with ASD (mean age = 9.7 years, SD = 2.4 years, range = 6 years to 14 years). Self-reports and mothers’ reports were collected about the girls’ EDB.
Results: There were only isolated associations between mothers’ data and the girls’ IQ. Selected aspects of the girls’ self-reported EDB were significantly associated with matrix reasoning.
Conclusion: The role of IQ, particularly matrix reasoning, in the assessment and treatment of EDB in girls with ASD, is highlighted by these findings.
Keywords: autism, eating disturbance, IQ, global processing
Introduction
Children with autism spectrum disorder (ASD) also commonly exhibit eating disturbances (EDB).1–4 Although there is some overlap in symptoms with formal diagnoses of eating disorders such as avoidant/restrictive food intake disorder,5 EDB in ASD do not usually include such disorders as bulimia nervosa or anorexia nervosa per se as distinct disorders, but EDB are rather usually often in the form of food selectivity or picky eating that is based upon the sensory aspects of certain foods, such as their taste, texture, smell, and color1 and that definition was used in this study. In that model, EDB may be conceptualized as a subgroup of the restricted and repetitive patterns of behavior that constitutes the second major diagnostic criterion for ASD.5
As might be expected, several core ASD-related features have been posited to account for the high prevalence of EDB in these children, including insistence on sameness, sensory features, concentration on detail, inability to tolerate novelty, and social communication difficulties.3 In addition, some evidence has also been found that suggests a role for cognitive function in EDB among children with ASD,1 particularly “executive function”. This term refers to a set of interrelated skills that are needed for effective future planning and goal-directed activity. The relatively low ability to plan and control their behavior that is often exhibited by children with ASD is hypothesized to result in them being self-restricted to certain foods and eating routines and for showing distress when there are changes to those eating patterns and routines.6
Several research reports have focused upon the role of intelligence quotient (IQ) and executive function as correlates of EDB in children with ASD, particularly when IQ is defined as “central coherence”, or the ability to integrate information from multiple sources into a coherent unit. For example, Happe and Frith7 reviewed 50 studies of the presence of weak coherence in ASD and noted that it might have been associated with a bias toward focusing upon the details of a stimulus rather than the overall import of that stimulus, and this might apply to a focus food color, taste, etc. instead of upon the wider issue of food nutritional value.8 In this way, some aspects of cognitive function can be seen to be associated with EDB in ASD and two of the four reviews of EDB in ASD, mentioned in the opening sentence of this paper and which covered 30 years of research up to 2015 (Rastam4 and Vissoker et al1), discussed the role of cognitive function, although not in great detail. A search (PubMed, Google Scholar) in January 2018 using the descriptors “eating disturbances, autism, IQ, cognition, executive, global” identified a further review that confirmed the presence of EDB in children with ASD9 and provided some support for the role of executive functioning in EDB in high-functioning children with ASD,10 among other similar studies. However, despite this focus upon the wider aspect of how central coherence might influence EDB, relatively few studies have examined the association between EDB and total IQ, verbal aspects of IQ, or performance aspects of IQ in children when measured via one of the standard scales for IQ. Hence, this study was designed to undertake that research in order to provide further clarification about the association between IQ and EDB in young people with ASD.
Several methodological decisions were made to enhance the value and applicability of data collected in this study for clinical settings. First, because most previous studies examined in the four reviews mentioned above included male or mixed male and female ASD samples (usually without separation of EDB data from males and females), this study recruited a female-only sample in order to extend the previous literature. Second, although it is common procedure to collect information on EDB from the parents of children with ASD (see the reviews mentioned above), there are also some data that demonstrate greater validity in the self-reports of anxiety in children with ASD over ratings of their anxiety by their parents when both are compared to a physiological indicator of chronic stress.11 Although EDB is not an anxiety disorder, self-reports of the eating behavior of young people with ASD might be a valuable index to compare with parental reports for the purposes of investigating the role of IQ in EDB. Third, some studies of cognitive function in ASD have legitimately used scales such as the differential ability scales 12 to measure nonverbal IQ,13 but more detailed indices of total IQ, verbal IQ, and performance IQ may be collected via the Wechsler range of intelligence scales, including the Wechsler Abbreviated Scale of Intelligence (2nd edition) (WASI-II).14 Fourth, the development of EDB in children with ASD occurs early in age but may change over time to adolescence,15 and so, the sample recruited in this study included girls with ASD aged between 6 years and 14 years and was identified as children vs adolescents via the World Health Organization definition of a child being less than 10 years of age and an adolescent being between 10 and 19 years of age.16 In addition, the sample was also divided into those girls who had reached menarche vs those who had not, as an indicator of the establishment of puberty. Due to the relative lack of prior research on this issue using these precise variable definitions, no specific directional hypotheses were set for testing; instead, the study was performed at an exploratory level.
Methods
Participants
Fifty girls (mean age = 9.7 years, SD = 2.4 years, range = 6–14 years) with ASD, plus their mothers, were recruited from a local parent support group and ASD service organizations in Queensland, Australia. The girls had all been previously diagnosed with ASD on the basis of a 2-hour clinical interview between a registered pediatrician or psychiatrist and the girl’s parents, followed by a similar interview with a registered clinical psychologist. These interviews used the relevant Diagnostic and Statistical Manual of Mental Disorders (DSM)-based diagnostic criteria for ASD plus family history. Because some of these original interviews were based upon earlier versions of the DSM series, the girls were again assessed with a confirmed ASD diagnosis for this study by a research-competent staff member using the DSM-55 criteria for ASD plus the ADOS-2.17 The girls’ IQ was assessed by the WASI-II14 during recruitment to ensure that they all scored at least 70 full scale IQ points. Because of this information, plus the fact that they were all attending mainstream schools and were capable of self-care appropriate to their age, they were classified as high functioning.
Instruments
The Autism Diagnostic Observation Schedule (Second Edition) (ADOS-2)
The ADOS-217 is a highly recommended standardized diagnostic observation tool for ASD.18,19 It presents a series of standardized interactive activities that focus upon social interactions, communication and repetitive behaviors, providing data for a diagnosis of ASD, and has demonstrated validity and reliability.17,20
The WASI-II
The WASI-II contains four subtests (vocabulary, similarities, block design, matrix reasoning). The first two of these four subtests comprise the composite score for the verbal comprehension index (VCI), previously called the verbal IQ score in the original WASI; the second two subtests are used to calculate the composite score for the perceptual reasoning index (PRI), previously known as the performance IQ. The VCI measures ability to understand, analyze, and interpret written information, whereas the PRI assesses the ability to use information gained through the senses, particularly visual stimuli, and to make sense of that information quickly, so as to make judgments about the world and act accordingly.14
For children aged between 6 years and 14 years, all four subtests have split-half reliability coefficients between 0.92 and 0.94, and the two composite scores are 0.94 and 0.92, respectively; the full scale IQ has a reliability of 0.92 when calculated from the two composite scores. The WASI-II has strong validity with the WISC-IV when used with high-functioning people with ASD.21 In order to enable comparisons across subtests, the t-scores were used, as is the practice recommended by the WASI-II authors.14
The Swedish Eating Assessment for ASDs (SWEAA)
Karlsson et al22 developed the SWEAA to measure 10 aspects of EDB via dedicated subscales covering aspects of perception, motor control, purchase of food, eating behavior, mealtime surroundings, social situation at mealtime, other behavior associated with disturbed eating, hunger/satiety, simultaneous capacity, and pica. Cronbach’s α are between 0.70 and above 0.80 for the eight SWEAA subscales. 22
Although the SWEAA was originally used to measure self-reported EDB in young adults with normal intelligence and ASD, it was adapted for the use of younger girls in this study by altering a few words (e.g., “I am plagued by food smells” to “I am annoyed by food smells”; I prefer food with a smooth texture” to “I prefer food that feels smooth in my mouth”) and deleting six items about dieting, binging, and purging behavior that were included by Karlsson et al22 to measure these aspects of EDB in young adults. Deletion of these six items did not also delete the subscale from which they were taken because two of the original items remained from that original subscale. A similar minor language revision in the wording of the items from first person to third person was made so that the SWEAA could be answered by the girls’ mothers about their daughters’ EDB. This modified version of the SWEAA comprised 54 items. Because the SWEAA is scored on a five-point scale from 1 (never), 2 (seldom), 3 (sometimes), 4 (usually), and 5 (always), the possible range of scores was from 54 to 270 in this study, with higher scores indicative of more severe EDB.
Procedure
Data were collected in the participants’ homes. The participants’ mothers and their daughters received written instructions and modelling on how to complete the SWEAA, and all participants completed a self-report on the degree to which they followed these instructions. Although complete consistency across participants cannot be guaranteed, there was no evidence of variation from the written instructions and modelling given to the mothers and their daughters. The WASI-II and ADOS-2 assessments were conducted with the girls in their homes prior to the collection of SWEAA data. The study was approved by the Bond University Human Research Ethics Committee and all procedures complied with the 1964 Helsinki declaration and its later amendments. Written informed consent was obtained from all mothers included in the study and the girls gave their assent to the study.
Statistical analysis
Data were analyzed via SPSS version 24 (IBM Corporation, Armonk, NY, USA) to obtain mean, SD, 5% trimmed mean, ranges, skewness and kurtosis values, and normality was assessed by the Kolmogorov–Smirnov statistic. Paired samples t-tests compared the mothers’ and daughters’ scores on the SWEAA, with 1,000 cases bootstrapping to increase the power of those analyses. Pearson correlation coefficients were calculated for the mothers’ SWEAA and girls’ SWEAA with WASI-II full scale score, composite scores and the four subtests, again using bootstrapping of 1,000 cases. A priori power analysis for the t-tests and Pearson correlation analyses with a medium effect of 0.45 indicated that a sample size of 45 would satisfy requirements for an α of 0.05 and β = 0.95. Although when testing hypotheses the p value is adjusted to account for an inflated type I error rate due to multiple testing, that procedure has been criticized when conducting exploratory studies because it reduces the chance of identifying a valuable finding for future testing in a priori studies23 and the increase in type II errors that accompanies such corrections.24 Therefore, it was decided to not apply a stringent correction procedure (e.g., Bonferroni adjustments) when undertaking multiple testing in this study but to comment about the p-values under limitations. Hierarchical regression was used to identify which SWEAA items had the strongest association with matrix reasoning.
Results
All the girls met the ADOS-2 cutoffs for presence of ASD. None of the WASI-II or SWEAA scores failed the Kolmogorov–Smirnov test for normality and so adjustment to the data was not required. The mean self-rated SWEAA score was 119.5 (SD = 28.9) and 122.2 (SD = 29.6) for the parents’ ratings. The mean WASI-II Full Scale score was 98.16 (13.08), ranging from 77 to 128. mean (and SD) t-scores for the four WASI-II subtests were block design mean = 48.4 (10.1), matrix reasoning mean = 50.8 (8.6), vocabulary mean = 49.4 (9.4), similarities mean = 47.6 (8.6). There were no significant main effects or univariate differences in the WASI-II full scale IQ or any of the four t-scale scores for the 26 girls versus 24 adolescents defined by the WHO categorization (main effect: F(5,43) = 0.920, p = 0.477), or for the 11 girls who had reached menarche versus the 39 who had not (main effect: F = 1.114, p = 0.367). Similarly, there were no significant differences in either the girls’ self-rated SWEAA scores or those given by their mothers according to either the WHO- (self-ratings: F = 0.291, p = 0.592; mothers’ ratings: F = 1.341, p = 0.251) or menarche-based (self-ratings: F = 0.177, p = 0.676; mothers’ ratings: F = 0.286, p = 0.595) dichotomizations, allowing the sample to be further analyzed as a whole. There was no significant correlation between the girls’ ages and their self-rated SWEAA scores (r = 0.004, p = 0.978) or their mothers’ SWEAA ratings of them (r = 0.251, p = 0.070). The Pearson correlation coefficient between the mothers’ SWEAA total score and the WASI-Full Scale score was r = –0.110, p = 0.446; for the girls’ self-reports on the SWEAA, the correlation with WASI-II full scale score was r = –0.366, p = 0.009. There was no significant difference between the mothers’ and girls’ SWEAA total scores (mothers’ mean = 120.96 [SD = 30.02]; girls’ mean = 117.36 [SD = 27.42]: t(49) = 0.938, p = 0.353). The correlation between those two SWEAA scores was 0.557 (p < 0.001) which, although statistically significant, accounted for only 31.% of the variance.
Pearson correlations between the two WASI-II composite scales and the two sets of SWEAA total scores (i.e., given by mothers and girls) are shown in Table 1. These data indicate that the significant inverse associations between SWEAA and IQ (i.e., higher IQ was associated with less severe EDB) were restricted to (a) perceptual reasoning but (b) only for the girls’ self-reports on the SWEAA, although the mothers’ SWEAA total scores were trending toward traditional levels of significant for their association with perceptual reasoning (p = 0.059) and block design (p = 0.062).
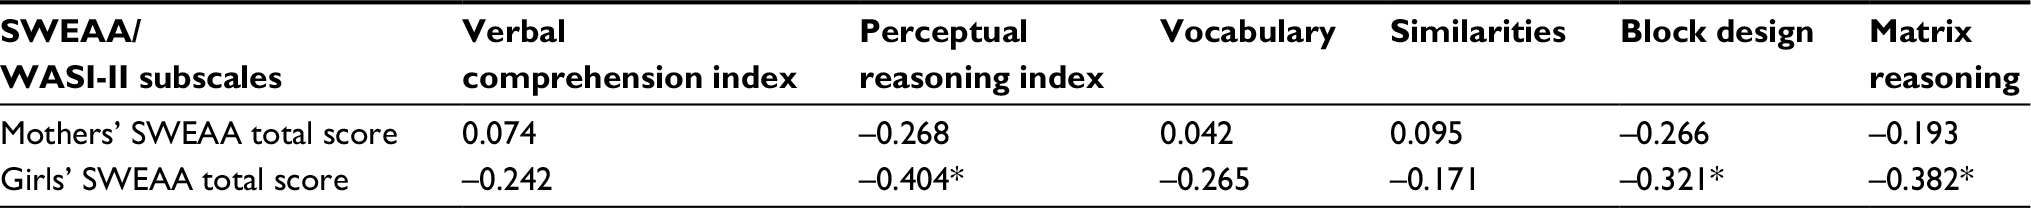 | Table 1 Pearson correlation coefficients between WASI-II composite and subtests (t-scores) and SWEAA total scores given by mothers and daughters Note: *p < 0.05. Abbreviations: SWEAA, Swedish Eating Assessment for ASDs; WASI-II, Wechsler Abbreviated Scale of Intelligence (2nd edition). |
Table 2 shows the Pearson correlations for the girls’ scores on the 10 SWEAA subscales and the WASI-II PRI and its subtest components. In addition to these data, the only significant (direct) correlation between the girls’ WASI-II VCI and SWEAA subscales was for simultaneous capacity (r = 0.305, p = 0.031). This devolved to a significant direct correlation between this aspect of the SWEAA and the WASI-II vocabulary t-scores (r = 0.392, p = 0.005) but there was no significant correlation between girls’ SWEAA simultaneous capacity and WASI-II similarities t-scores (r = 0.151, p = 0.295). There was an isolated significant inverse correlation between the girls’ WASI-II PRI and the SWEAA simultaneous capacity scores given by their mothers about their daughters (r = –0.359, p = 0.010), which devolved into significant inverse correlations between this SWEAA subscale and the WASI-II block design (r = –0.294, p = 0.039) and matrix reasoning (r = –0.331, p = 0.019).
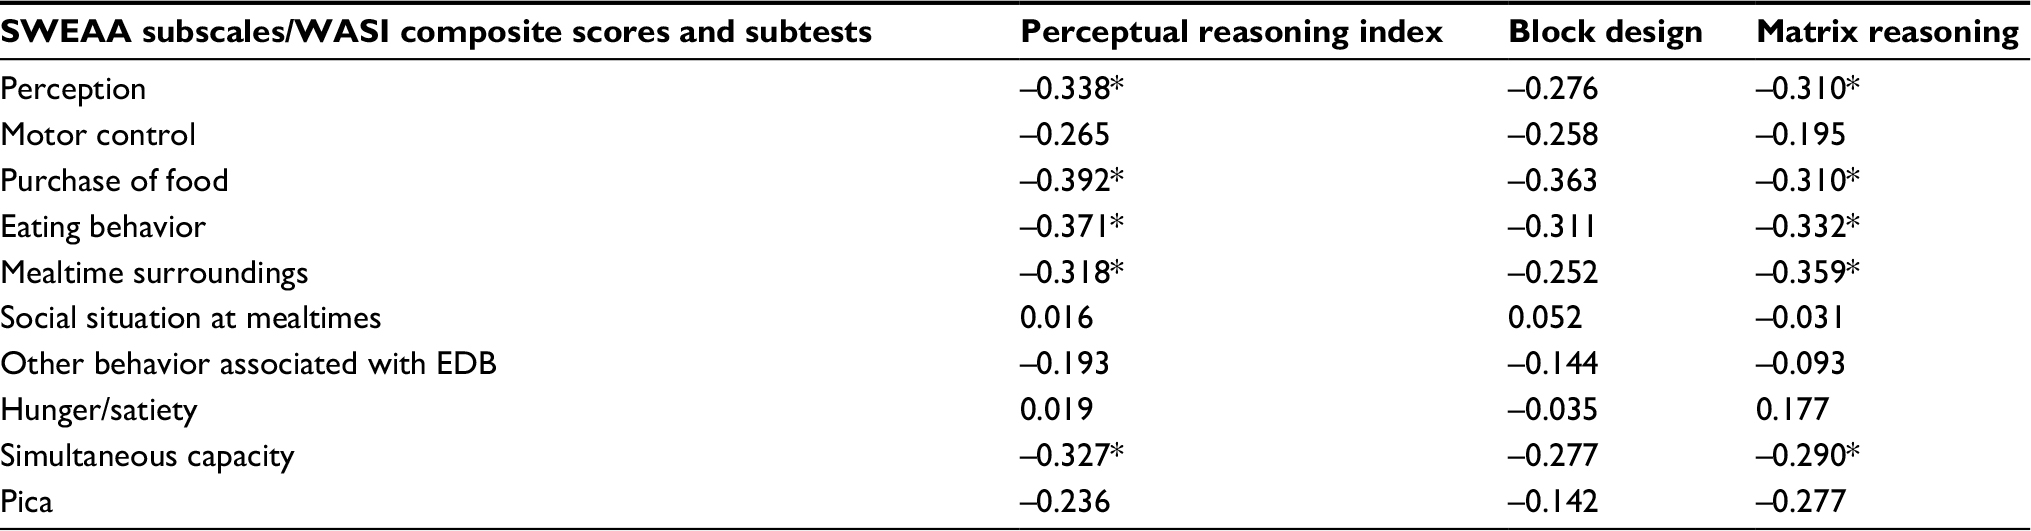 | Table 2 Pearson correlation coefficients between WASI-II perceptual reasoning index and subtests (t-scores) and SWEAA subscale scores given by daughters Note: *p < 0.05. Abbreviations: EDB, eating disturbance behaviors; SWEAA, Swedish Eating Assessment for ASDs; WASI-II, Wechsler Abbreviated Scale of Intelligence (2nd edition). |
These correlational analyses help to identify the relative roles of the WASI-II subtests and the associations they had with selected aspects of EDB as measured by the SWEAA. However, those aspects of EDB (i.e., the SWEAA subtests) comprises several different items that measure different EDB. For example, the SWEAA perception subscale measures 11 different eating-related behaviors. Therefore, to identify which specific eating behaviors were influenced by matrix reasoning, each of the sets of SWEAA items that made up the five SWEAA subscales shown to have significant correlations with matrix reasoning scores were examined. From that process, the specific SWEAA items that significantly correlated with the WASI-II matrix reasoning t-scores were identified and are presented in Table 3. These results suggest that, although all 10 of these specific EDB were significantly and inversely associated with WASI-II matrix reasoning, the sizes of those correlation coefficients were quite different, and so the five SWEAA items with the strongest correlation coefficients were selected for regression analysis to compare the relative strength of their relationships with WASI matrix reasoning.
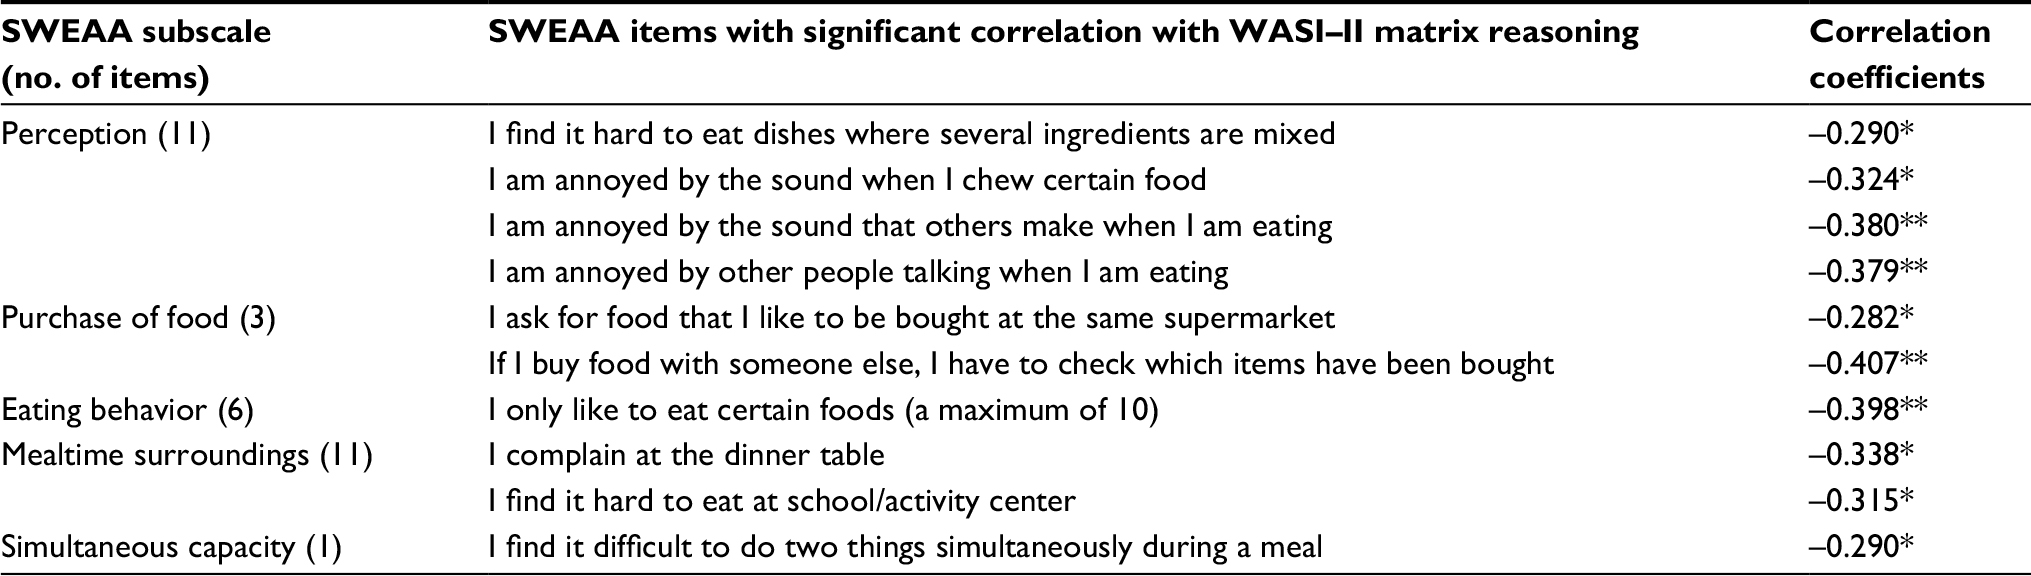 | Table 3 Significant correlations between SWEAA subscale items and WASI-II matrix reasoning t-score Notes: *p < 0.05, **p < 0.01. Abbreviations: SWEAA, Swedish Eating Assessment for ASDs; WASI-II, Wechsler Abbreviated Scale of Intelligence (2nd edition). |
Multiple regression produces information about “the relationship between a DV and several IVs”(p. 112).25 In the current study, those variables are the (i) SWEAA items with the strongest correlations coefficients shown in Table 3 and (ii) WASI-II matrix reasoning t-scores. The strength of the relationships between SWEAA items and Matrix Reasoning might be revealed by measurement of the relative amount of variance in the matrix reasoning scores that each SWEAA item accounts for, indicated by the R2 value for each SWEAA item. One particular form of regression (hierarchical regression) allows for the entry of the SWEAA items into the regression process in a series of steps according to some criteria so that the amount of extra variance in matrix reasoning that is accounted for by each SWEAA item may be identified. This isolates the “key” SWEAA items that are most powerfully related to matrix reasoning in a way that takes into account the relationships between (previously entered) SWEAA items and produces much more information than simple correlation coefficients like those shown in Table 3.
Therefore, hierarchical regression was used in this study to identify which of the SWEAA items had the strongest association with matrix reasoning when other items were taken into account. The four SWEAA items with correlation coefficients at p < 0.01 level were chosen for this analysis because the remaining SWEAA items had relatively smaller correlation coefficients with matrix reasoning. These four SWEAA items were entered into the hierarchical regression order of their correlation coefficients shown in Table 3. The total variance in matrix reasoning explained by these four SWEAA items was 35.1% F(4,49) = 6.083, p = 0.001. However, only SWEAA items “I only like to eat certain foods (a maximum of 10)” (R2 change= 15.9, F(1,48) change = 9.041, p = 0.004, β = –0.442, p = 0.001), and “I am annoyed by the sounds others make when I am eating” (R2 change= 17.9, F(1,47) change = 12.707, p = 0.001, β = –0.425, p = 0.001) made significant (inverse) contributions to the variance in matrix reasoning. The remaining two SWEAA items accounted for only less than a further 1.5% of the variance in matrix reasoning. On this basis, it may be concluded that these two SWEAA items had the strongest inverse relationships with matrix reasoning.
Discussion
The major aim of this study was to explore the association between EDB and total, verbal, and performance aspects of IQ in a sample of young females with ASD. Results indicated that the major significant (inverse) associations found were between the girls’ self-rated EDB and their WASI-II IQ Full Scale IQ, which then resolved into a significant inverse association with the PRI aspects of IQ measured by matrix reasoning and block design. When examined at the level of the girls’ SWEAA subscales, it became apparent that the significant inverse associations were between five aspects of EDB and the matrix reasoning subtest of the WASI-II (although there was an isolated direct significant association between SWEAA simultaneous capacity and WASI-II vocabulary t-scores). Thus, it appears from these data that those aspects of EDB that were measured by certain SWEAA total scores were significantly and inversely linked with the cognitive skills measured by the WASI-II matrix reasoning subtest. As noted by Sattler,26 matrix reasoning requires “experience with part-whole relationships and pattern completion and a willingness to respond when uncertain” (p. 340). Two aspects of that description are directly relevant to children with ASD: (i) understanding the way that individual stimuli fit together to form a global entity, plus (ii) confidence to overcome uncertainty and make a response to stimuli.
As described in the Introduction section earlier, there is some evidence that young people with ASD have difficulties understanding how parts make a whole, which may influence their ability to comprehend the multiple stimuli across several sensory areas that they encounter when eating. That is, food may vary according to its flavor, smell, texture, color, and preparation protocols; variation in the combination of those factors across different foodstuffs may be a challenge for young people who have a strong preference for sameness, which may derive from their ability to cognitively encompass the entire range and spectrum of stimuli that form a gestalt. When the social demands of mealtimes are added to these sensory challenges, it is not surprising that many children with ASD exhibit at least some aspects of EDB. Being limited in their cognitive ability to make sense of these multiple stimuli, and then formulate them into a comprehensible “whole” that includes mealtimes and nutritious eating habits, may be an outcome of the slower underlying nonverbal fluid reasoning processes that have been attributed to young people with ASD.27 That hypothesis was supported by the current findings regarding the inverse association between matrix reasoning and EDB.
In addition to this purely cognitive aspect of vulnerability to EDB, these children may also lack the necessary confidence to overcome their uncertainty with regard to understanding the stimuli they receive and then responding to those stimuli successfully. That is, many children with ASD also experience comorbid anxiety,28 with the prevalence of Generalized Anxiety Disorder quoted as about 13%,29,30 well above the 12-month prevalence rate of approximately 1% for the general population of children and adolescents.5 This presence of anxiety may interact with slower ability to make sense of the variety of food-related stimuli they receive during mealtimes to produce those aspects of EDB that were tapped by the SWEAA subscales and which had a significant correlation with the WASI-II matrix reasoning subtest.
However, EDB is a heterogeneous construct, as indicated by the range of eating-related behaviors measured by the SWEAA,22 and it was reasonable to investigate how matrix reasoning was related to those specific eating-related behaviors. When examined at the subscale level of the SWEAA, the association between EDB and matrix reasoning was seen to be nonuniform, with only four of the 11 aspects of EDB that are measured by the SWEAA subscales having significant inverse correlations with matrix reasoning (Table 2). The relative isolation of the associations between a fixed number of EDB behaviors with matrix reasoning was further examined via the specific SWEAA items that comprise those four SWEAA subscales (Table 3) and revealed that just 10 of the 54 items in the version of the SWEAA used here were significantly and inversely linked with matrix reasoning. Although these 10 EDB were sufficient to contribute to the overall significant association between the girls’ self-reports on the SWEAA and the WASI-II Full Scale IQ, the findings reported in Tables 2 and 3 suggest that (a) not all aspects of EDB are necessarily affected by nonverbal fluid reasoning processes, and (b) the pattern of those significant associations appears to be heavily reliant on the strong preference these children may have for eating certain foods (a maximum of 10), plus their annoyance at the sounds other people made while eating. Although these are not the only aspects of EDB that are affected by these children’s ability to reason nonverbally, they may be most powerfully connected to that aspect of cognitive function.
There were other (relatively isolated) significant associations between some aspects of EDB and the other three WASI-II subtests, but those were limited to the girls’ self-rated SWEAA subscale for simultaneous capacity and their WASI-II vocabulary subtest scores, and between the girls’ SWEAA simultaneous capacity scores awarded by their mothers and their WASI-II block design and matrix reasoning. The SWEAA simultaneous capacity subscale reflects the participant’s ability to undertake more than one task at a time and is measured by the single item “I find it difficult to do two things simultaneously during a meal, for example, chewing and cutting the food”. Scores on this item may indicate several aspects of ASD-related symptomatology such as restricted interests and repetitive behavior5 as well as EDB. That is, low scores on this SWEAA item are open to interpretation of an overall difficulty in engaging in multiple tasks simultaneously rather than a specific eating-related behavior. As such, SWEAA simultaneous capacity may be more closely associated with the ASD symptoms of restricted and repetitive behavior than EDB. The significant direct correlation with the WASI-II vocabulary subtest, which measures knowledge of words and is also related to cultural opportunities,26 may reflect the lack of enculturation that can accompany ASD due to the difficulties these children have in understanding social communication and interacting socially.5 Block design also measures nonverbal reasoning similarly to matrix reasoning,26 and so the significant association between SWEAA simultaneous capacity and this aspect of the WASI-II may be parallel to the majority of significant associations found between EDB and matrix reasoning in this study.
These results have several valuable implications for practice. First, these data from a sample of girls with ASD represent the most focused investigation of IQ and EDB in young females with ASD reported to date and therefore might be considered when dealing with the EDB of young females with ASD. Second, the common practice of collecting EDB evaluations and descriptions solely from the parents of young people with ASD is challenged by these data, not because there is any basis for questioning the validity of those parental evaluations, but because the self-reports collected in this study were linked with matrix reasoning but the parents’ reports were not. That does not mean that parents’ reports are not valuable when developing treatments for EDB in these children, but rather that consideration of the possible roles of various aspects of IQ in the manifestation of EDB might best be based upon the reports given by young people with ASD about their own EDB. Third, although there are several valid and reliable scales for measuring IQ, the use of a Wechsler-based scale is most likely to produce data that are relevant to the association between nonverbal fluid reasoning and EDB in young people with ASD. Finally, the lack of any significant difference in the SWEAA scores from either mothers or daughters across the two methods of differentiating children from adolescents (i.e., WHO criteria, presence of menarche) challenges the suggestion that adolescence is more likely to be associated with EDB than childhood in young females with ASD, although the restricted range of adolescent ages (i.e., only up to aged 14) limits this finding.
Other limitations in this study are the decision to restrict the sample to just females, thus preventing any cross-gender comparison. This would be valuable in understanding how IQ and EDB are related for both genders and should be a target for future research. A similar restriction on sampling was the recruiting of participants from one geographical area of one nation, and cross-cultural generalization would benefit from replication in other settings and cultures. Further, only high-functioning females were recruited, and there is no intention to imply these findings to low-functioning females with ASD or to girls with no diagnosis of ASD: these comparative studies would be of value in extending the data reported in this initial study. The girls’ body mass indices were not collected in this study and could provide valuable information in future studies. The decision not to adjust p-values for the possible type I error inflation due to multiple correlations coefficient testing was made on the basis of this being an exploratory study but must be acknowledged as a possible limitation that is appropriate at this early stage of investigation but would need to be remade when formal hypothesis-testing studies were undertaken to determine the strength of the associations found here. Similarly, snapshot studies, such as this one, are valuable in reporting initial data but they do not allow for any “causal” inferences to be drawn, and the extension of this research via a prospective design would help with that objective. Finally, the SWEAA is well validated and reliable but is subject to the kinds of bias that sometimes impedes the value of self-report procedures: use of objective observations of actual EDB over an extended period would help decide the relative validity of the single measure of EDB used in this study.
However, all research has limitations and, within the restrictions mentioned above, the findings from this study offer an initial model of the way in which some aspects of IQ might affect EDB in young females with ASD. Because EDB is “over-represented in ASD at all ages and all cognitive levels” (p. 38),4 attention to the possible correlates of EDB in these young females remains of major importance in assisting them to undertake eating with a view to adequate nutrition and to learn how to engage in the social interactions that are a significant benefit of mealtimes. Although these tasks represent major challenges for those with ASD, they also have the potential to provide nurturance in both physiological and psychological terms. As such, successful management of EDB in ASD represents a worthwhile focus for future interventions. Understanding how at least one of the possible contributors to EDB (i.e., matrix reasoning) might act as a potential catalyst to improved lifestyles and health of young people with ASD can assist in the development of those interventions.
Disclosure
The authors report no conflicts of interest for this work.
References
Vissoker R, Latzer Y, Gal E. Eating and feeding problems and gastrointestinal dysfunction in autism spectrum disorders. Res Autism Spectr Disord. 2015;12:10–21. | ||
Cermak S, Curtin C, Bandini L. Food selectivity and sensory sensitivity in children with autism spectrum disorders. J Am Diet Assoc. 2010;110(2):283–246. | ||
Ledford J, Gast D. Feeding problems in children with autism spectrum disorders: a review. Focus Autism Other Dev Disabl. 2006;21(3):153–166. | ||
Rastam M. Eating disturbances in autism spectrum disorders with focus on adolescent and adult years. Clin Neuropsychiatry. 2008;5(1):31–42. | ||
APA. Diagnostic and Statistical Manual of Mental Disorders-5. Washington, DC: American Psychiatric Association; 2013. | ||
Turner M. Annotation: repetitive behaviour in autism: a review of psychological research. J Child Psychol Psychiatry. 1999;40(6):839–849. | ||
Happe F, Frith U. The weak coherence account: detail-focussed cognitive style in autism spectrum disorders. J Autism Dev Disord. 2006;36(1):5–25. | ||
Zhou Z, McAdam D, Donnelly D. Endophenotypes: a conceptual link between anorexia nervosa and autism spectrum disorder. Res Dev Disabil. Epub 2017 Nov 24. | ||
Kuschner E, Eisenberg I, Orionzi B, et al. A preliminary study of self-reported food selectivity in adolescents and young adults with autism spectrum disorder. Res Autism Spectr Disord. 2015;15–16:53–59. | ||
Fitch A, Fein DA, Eigsti I-M. Detail and gestalt focus in individuals with optimal outcomes from autism spectrum disorders. J Autism Dev Disord. 2015;45(6):1887–1896. | ||
Bitsika V, Sharpley C, Andronicos M, Agnew L. Agreement between self- vs parent-ratings of General Anxiety Disorder symptoms and salivary cortisol in boys with an ASD. J Dev Phys Disabil. 2015;27(4): 467–477. | ||
Elliott C. Differential Ability Scales. San Antonia, TX: Psychological Corporation; 1990. | ||
Bishop S, Richler J, Lord C. Association between restricted and repetitive behaviors and nonverbal IQ in children with autism spectrum disorders. Child Neuropsychol. 2006;12(4–5):247–267. | ||
Wechsler D. The Wechsler Abbreviated Scale of Intelligence (2nd ed). Bloomington, MN: Pearson; 2011. | ||
Beighley J, Matson J, Rieske R, Adams H. Food selectivity in children with and without an autism spectrum disorder: investigation of diagnosis and age. Res Dev Disabil. 2013;34(10):3497–3503. | ||
WHO. Adolescent Health. Geneva: WHO; 2017. | ||
Lord C, Rutter M, DiLavore P, Risi S, Gotham K, Bishop S. Autism Diagnostic Observation Schedule, Second Edition (ADOS-2). Los Angeles, CA: Western Psychological Services; 2012. | ||
Filipek P, Accardo P, Baranek G, et al. The screening and diagnosis of autistic spectrum disorders. J Autism Dev Disord. 1999;29(6):439–484. | ||
National Research Council. Educating Children with Autism. Washington, DC: National Academy Press; 2001. | ||
Gotham K, Risi S, Pickles A, Lord C. The autism diagnostic observation schedule: revised algorithms for improved diagnostic validity. J Autism Dev Disord. 2006;37(4):613–627. | ||
Minshew N, Turner C, Goldstein G. The application of short forms of the Wechsler intelligence scales in adults and children with high functioning autism. J Autism Dev Disord. 2005; 35(1): 45–52. | ||
Karlsson L, Rastam M, Wentz E. The SWedish Eating Assessment for Autism spectrum disorders (SWEAA)--validation of a self-report questionnaire targeting eating disorders within the autism spectrum. Res Dev Disabil. 2013;34(7): 2224–2233. | ||
Streiner D, Norman G. Correction for multiple testing. Chest. 2011;140(1):16–18. | ||
Rothman K. No adjustments are needed for multiple comparisons. Epidemiology. 1990;1(1):43–46. | ||
Tabachnik B, Fidell L. Using Multivariate Statistics. 6th ed. Boston, MA: Pearson Education; 2013. | ||
Sattler J. Assessment of Children. La Mesa, CA: Jerome M Sattler, Publishers, Inc.; 2008. | ||
Van der Hallen R, Evers K, Brewaeys K, Van den Noortgate W, Wagemans J. Global processing takes time: a meta-analysis on local-global visual processing in ASD. Psychol Bull. 2015;141(3):549–573. | ||
White S, Oswald D, Ollendick T, Scahill L. Anxiety in children and adolescents with autism spectrum disorders. Clin Psych Rev. 2009;29:216–229. | ||
Kim J, Szatmari P, Bryson S, Streiner D, Wilson F. The prevalence of anxiety and mood problems among children with autism and Asperger syndrome. Autism. 2000;4(2):117–132. | ||
Simonoff E, Pickles A, Charman T, Chandler S, Loucas T, Baird G. Psychiatric disorders in children with autism spectrum disorders: prevalence, comorbidity, and associated factors in a population-derived sample. J Am Acad Child Adolesc Psychiatry. 2008;47:921–929. |
 © 2018 The Author(s). This work is published and licensed by Dove Medical Press Limited. The full terms of this license are available at https://www.dovepress.com/terms.php and incorporate the Creative Commons Attribution - Non Commercial (unported, v3.0) License.
By accessing the work you hereby accept the Terms. Non-commercial uses of the work are permitted without any further permission from Dove Medical Press Limited, provided the work is properly attributed. For permission for commercial use of this work, please see paragraphs 4.2 and 5 of our Terms.
© 2018 The Author(s). This work is published and licensed by Dove Medical Press Limited. The full terms of this license are available at https://www.dovepress.com/terms.php and incorporate the Creative Commons Attribution - Non Commercial (unported, v3.0) License.
By accessing the work you hereby accept the Terms. Non-commercial uses of the work are permitted without any further permission from Dove Medical Press Limited, provided the work is properly attributed. For permission for commercial use of this work, please see paragraphs 4.2 and 5 of our Terms.