")
Back to Journals » Journal of Inflammation Research » Volume 8
An ex vivo RT-qPCR-based assay for human peripheral leukocyte responsiveness to glucocorticoids in surgically induced inflammation
Authors Gråberg T, Strömmer L, Hedman E, Uzunel M, Ehrenborg E, Wikström A
Received 7 March 2015
Accepted for publication 17 April 2015
Published 19 August 2015 Volume 2015:8 Pages 149—160
DOI https://doi.org/10.2147/JIR.S84165
Checked for plagiarism Yes
Review by Single anonymous peer review
Peer reviewer comments 3
Editor who approved publication: Professor Ning Quan
Truls Gråberg,1 Lovisa Strömmer,1 Erik Hedman,2 Mehmet Uzunel,3 Ewa Ehrenborg,4 Ann-Charlotte Wikström5
1Division of Surgery, Department of Clinical Science, Intervention and Technology (CLINTEC), Karolinska Institutet, 2Department of Clinical Pharmacology, Karolinska University Hospital, 3Division of Therapeutic Immunology, Department of Laboratory Medicine, 4Atherosclerosis Research Unit, Department of Medicine, Solna, 5Unit of Translational Immunology, Department of Medicine, Solna, Karolinska Institutet, Stockholm, Sweden
Introduction: An assay to determine glucocorticoid (GC) responsiveness in humans could be used to monitor GC non-responsiveness in states of GC insufficiency and could provide a tool to adapt GC treatment to individual patients. We propose an ex vivo assay to test GC responsiveness in peripheral leukocytes. The assay was evaluated in a human experimental model of surgery-induced inflammation.
Patients and methods: Changes in expression of the GC-regulated genes GILZ, IL1R2, FKBP5, and HLA-DR and glucocorticoid receptor alpha (GRα) were determined by reverse transcriptase quantitative polymerase chain reaction (RT-qPCR) in peripheral leukocytes from surgical patients and healthy blood donors (total n=60) in response to low (1 nM) and high (1 µM) dexamethasone (DEX). The final selection of a suitable endogenous control gene was based on the studies of stability during DEX treatment and inflammation. Correlations between pre- and postoperative GC-induced gene expression, the postoperative systemic inflammatory and metabolic response (CRP, IL-6, white blood cell count, cytokines, resistin, free fatty acids, glucose, insulin, and adiponectin), and the clinical outcome were analyzed. The length of stay in the intensive care unit (ICU-LOS), the length of stay in the hospital, and postoperative complications were used to measure clinical outcome.
Results: When the blood donors were compared to the patients, there were no significant differences in the regulation of the genes in response to DEX, except for GRα. Preoperative, but not postoperative, gene regulation of GILZ and GRα was negatively correlated to ICU-LOS (P<0.05 and P<0.01, respectively). Preoperative GILZ and FKBP5 gene regulation was negatively correlated to postoperative systemic TNFα and MIP-1α levels.
Conclusion: We suggest that this assay could be used to determine GC responsiveness. An alteration in preoperative GC responsiveness may be related to a patient's ability to recover from surgically induced inflammatory stress.
Keywords: glucocorticoid responsiveness, gene regulation, clinical outcome, GILZ, GRα, cytokines
Introduction
Corticosteroid insufficiency is observed in a variety of states involving severe inflammation (eg, hemorrhagic shock, acute pancreatitis, critical illness, and severe sepsis) and is associated with an increase in morbidity and mortality.1–4 However, the diagnosis of corticosteroid insufficiency is fraught with difficulties because the cells’ response to cortisol is the most important factor, rather than the circulating concentration of this hormone.2 An assay to determine actual glucocorticoid (GC) responsiveness in humans could not only enable the diagnosis and monitoring of diminished GC responsiveness in states of corticoid insufficiency and inflammation, but could also provide a tool for customizing GC treatment to individual patients.
Several methodologies have been investigated for determining cellular GC responsiveness in circulating human blood cells.5–7 Vermeer et al6 showed that GC-induced upregulation of the FK506 binding protein 5 (FKBP5) in human leukocytes could be used as a marker of GC responsiveness. FKBP5 interacts with the glucocorticoid receptor (GR) and the subsequent GR-associated transcription machinery.8 Burnsides et al found similar upregulation in experiments using FKBP5 and the GC-induced leucine zipper (GILZ) gene, which is involved in the regulation of inflammation.5 However, these assays have only been used in limited studies of altered GC responsiveness in clinical states that involve GC dysregulation5,6 and the assays have not been evaluated in states of severe inflammation.
Using an expanded and modified version of the assay, used by Burnsides et al, we sought to study cellular GC responsiveness in the context of systemic inflammation.5 We selected major elective surgery in humans as our model.
In the present study, we propose an ex vivo assay that uses reverse transcriptase quantitative polymerase chain reaction (RT-qPCR) to test GC responsiveness in whole blood. Specifically, we studied GC-induced gene regulation at physiological and supraphysiological GC concentrations using genes that would be expected to be upregulated: GILZ, interleukin 1 receptor II (IL1R2), and FKBP5, and genes that would be expected to be downregulated: human leukocyte antigen DR (HLA-DR) and glucocorticoid receptor alpha (GRα). The genes were selected based on previous reports of GC regulation.9–11 The GRα gene was used because of its role in feedback regulation of GCs.12 The responses of five housekeeping (HK) genes to GC stimulation and inflammation from surgical trauma were evaluated in order to identify the most suitable endogenous control gene.
We found correlations between preoperative GC-induced gene expression and clinical outcome (length of stay in the intensive care unit [ICU-LOS]), as well as correlations with markers of the postoperative systemic inflammatory response.
Patients and methods
Study design
The study was performed in two cohorts of blood donors (BD1 n=21 and BD2 n=9) and in two patient cohorts (PAT1 n=9 and PAT2 n=21). The analysis of data was performed in four parts: A) the evaluation of possible GC-regulated genes in peripheral leukocytes in BD1 and PAT1; B) the evaluation of the stability of endogenous control genes in response to dexamethasone (DEX) in BD2 and PAT2; C) the correlation of GC gene regulation between low (1 nM) and high (1 μM) DEX concentrations during conditions without surgery-induced inflammation (preoperatively) and with surgery-induced inflammation (postoperatively) in PAT2; and D) the correlation between pre- and postoperative GC-stimulated gene expression change and systemic markers of inflammation (CRP, IL-6, white blood cell count, and cytokines) and metabolic response (resistin, free fatty acids, glucose, insulin, and adiponectin) as well as clinical outcomes – ICU-LOS, length of stay in the hospital, and postoperative complications in PAT2.
Blood donors
Whole blood from two cohorts of healthy blood donors was drawn in heparinized tubes according to the standard procedures at the blood donation facilities operated by the Department of Transfusion Medicine at Karolinska University Hospital. The Stockholm Regional Ethical Review Board does not require an ethical permission for the use of non-identified healthy donor samples.
Surgical patients
The ethical permission for the surgical patients (2009/366-31) was granted by the Stockholm Regional Ethical Review Board. Consecutive patients planned for gastrointestinal surgery were recruited and included after having given informed consent. Blood was sampled in standard Ethylenediaminetetraacetic acid (EDTA) tubes on the day of surgery. No patients received GCs or anti-inflammatory agents before the operation. Blood was again sampled between 8 and 9 am on the first postoperative day. Fresh blood was used for the GC responsiveness assays, and plasma was frozen rapidly at −80°C for later analysis of inflammatory and metabolic markers.
Incubation with GC
A total of 900 μL of blood was supplemented with 100 μL of medium with or without DEX (Sigma-Aldrich, St Louis, MO, USA) and incubated overnight. We used a final concentration of 10−6 M (high) or 10−8 M (low) DEX or medium only. Medium was RPMI-1640 (Gibco, Paisley, UK), with 2 mM l-glutamine (Life Technologies, Stockholm, Sweden) and 50 IU/mL of penicillin and 50 μg/mL of streptomycin (Gibco). No fetal calf serum was used. Only the high DEX concentration was used in part A of the study. In parts B–D, both low and high DEX concentrations were used for stimulation. Incubation was performed overnight (16–22 hours) in 5% CO2 at 37°C in 50 mL polypropylene tubes with the lids left untightened.
Extraction of leukocyte RNA
The erythrocytes were lysed after the incubation, using cold ammonium lysis buffer (153 mM NH4Cl, 10 mM KHCO3, and 0.01 mM EDTA adjusted to pH 7.4–7.5).
After lysis and washing, leukocyte pellets were resuspended in 350 μL of RLT Buffer (from QIAGEN RNEasy Kit, QIAGEN AB, Stockholm, Sweden). RNA was then extracted from the leukocyte suspension using silica-based precipitation columns according to the manufacturer’s protocols. The RNA obtained was eluted in 36 μL of RNase free water, and 6 μL of the resulting solution was used for spectrophotometric measurement of RNA concentration and purity. The 260 nM/230 nM absorbance ratio was >1.7 in BD1 and PAT1 and >1.8 in BD2 and PAT2, which was in the acceptable range. Samples were diluted to the RNA concentration of <50 μg/mL.
Reverse transcription
In cohorts BD1 and PAT1, cDNA synthesis was performed in 1× first strand buffer (50 mM Tris–HCl pH 8.3, 75 mM KCl, and 3 mM MgCl2), 105 μg/mL pdN6 (GE Healthcare Bio-Sciences AB, Uppsala, Sweden), 1 mM of each dNTP (GE Healthcare Bio-Sciences AB), 1 mM DTT, 0.48 units/μL RNasin (Promega Corporation, Madison, WI, USA), and 4.8 units/μL M-MLV Reverse Transcriptase (RT) (Invitrogen, Paisley, UK). For cohorts BD2 and PAT2, a proprietary high-capacity reverse transcription kit was used (Applied Biosystems, Foster City, CA, USA), including its RNase inhibitor and recombinant version of RT. All reactions were performed at 37°C, as per the manufacturer’s protocols, for 90 minutes in a total volume of 50 μL containing 30 μL of the RNA solution, and terminated at 85°C for 1 minute.
We conducted several experiments evaluating the addition of DNase treatment to the protocol (data not shown). On-column treatment with RNase free DNase (QIAGEN AB) was included in BD2 and PAT2 cohorts.
Selection of target genes for RT-qPCR
Data from a previous study on GC gene regulation9 were collected from Gene Expression Omnibus (http://www.ncbi.nlm.nih.gov/geo/), dataset GSE2842 and reanalyzed with GeneChip Operating Software (GCOS) version 1.4 (Affymetrix Inc., Santa Clara, CA, USA). Details are provided in the “Gene Expression Omnibus data” section in supplementary materials.
Selection of endogenous control gene for RT-qPCR
Five different HK genes were evaluated for possible use as endogenous control genes in the studies of GC gene regulation. The HK genes tested in patient samples were beta-2-microglobulin (B2M) (NM_004048.2), cyclophilin (NM_021130.3), ribosomal protein, large, P0 (RPLP0) (NM_053275.3), glucose-6-phosphate dehydrogenase (G6PD) (NM_000402.4), and the Abelson protein (ABL) (NM_005157). The primer and probe sequences are listed in Table S1.
Measuring gene regulation
Expression levels for the five GC-regulated target genes were measured using RT-qPCR. RT-qPCR was run on an ABI 7000 Sequencer-detector (Applied Biosystems), using the following PCR conditions: 50°C for 2 minutes, 95°C for 10 minutes followed by 40 PCR amplification cycles with 95°C for 15 seconds and 58°C for 1 minute. A Reporter, normalized-threshold level of 0.025 was used. All samples were run in duplicate, and their average difference in cycles to threshold (CT) was compared to that of the control gene. Relative expression levels, reflecting up- or downregulation (ie, change in expression), were derived by using the delta-delta-CT calculation method.13 In BD1 and PAT1, G6PD was used as the endogenous control gene, but after evaluation (see below), it was replaced by RPLP0 in PAT2.
Systemic concentrations of inflammatory and metabolic markers
Plasma obtained pre- and postoperatively was analyzed for cortisol, insulin, and c-peptide using electrochemiluminescence immunoassays. Glucose was measured in the plasma by reflectance photometry, and adiponectin was determined by a radioimmunoassay. A 21-plex cytokine panel (Merck Millipore, Billerica, MA, USA) was used to measure eotaxin, GM-CSF, IFNγ, IP-10, IL-1Rα, IL-1β, IL-1α, IL-2, IL-4, IL-5, IL-6, IL-7, IL-8, IL-9, IL-10, IL-12p40, IL-12p70, MCP-1, MIP-1α, MIP-1β, and TNFα, by magnetic bead fluorescence multiplex immunoassay. The measurements were performed on a Magpix instrument (Luminex Corporation, Austin, TX, USA). Plasma levels of resistin were determined using a Quantikine ELISA Kit (Novakemi, Handen, Sweden). Non-esterified fatty acid concentrations in plasma were measured pre- and postoperatively using an enzymatic colorimetric assay from Wako Chemicals (Nordic Biolabs, Täby, Sweden).
Clinical outcome
Days of care in the ICU-LOS and length of stay in the hospital were recorded. Postoperative complications were graded according to Dindo et al.14 This was done independently by two surgeons who were blinded to all of the results of the study.
Statistical methods
Summary statistics are presented as median and interquartile range (IQR). Gene regulation data were analyzed and are shown as log(2) fold change. The one-sample t-test was used to analyze whether significant up- or downregulation had occurred. Equality of variance and normality was analyzed using Levene’s test and Shapiro–Wilk’s test, respectively. Group-wise comparisons were performed by independent samples Student’s or Welch’s t-test depending on the variance and normality. Testing of differences and calculation of correlations were performed using related samples Wilcoxon signed-rank test and Spearman’s rank correlation (“ρ”) or paired Student’s t-test and the Pearson correlation (“r”), as appropriate.
Results
Selection of target genes for RT-qPCR
Suitable upregulated genes were IL1R211 (NM_004633 and NM_203416), FKBP56,8 (NM_004117), and GILZ15 (NM_198057). The downregulated genes that were suitable were HLA-DR16 (NM_002124) and GRα12 (NM_001018075). The primer and probe sequences are listed in Table S1.
GC-regulated genes in blood donors and surgical patients
GC-induced gene expression of GILZ, IL1R2, FKBP5, HLA-DR, and GRα in the BD1 and PAT1 cohorts is shown in Figure 1. In the BD1 cohort, we observed significant upregulation and downregulation for all tested genes (GILZ, IL1R2, FKBP5, HLA-DR, and GRα) with respect to the endogenous control genes G6PD and B2M. All genes were moderately to strongly correlated to endogenous control genes G6PD and B2M (all r=0.6–0.9 and P<0.001), except for GRα (r=0.5, ns). There was a −0.74 difference in log(2) expression between B2M and G6PD (all P<0.005). The genes GILZ, IL1R2, FKBP5, HLA-DR, and GRα were tested in the first cohort of preoperative samples from surgical patients (PAT1, n=9), using G6PD as the endogenous control.
 | Figure 1 Gene expression of GC-regulated genes in peripheral leukocytes in response to 1 μM dexamethasone (DEX) in healthy blood donors (BD1, n=21, A) and in surgical patients (PAT1, n=9, B) using the endogenous control G6PD. |
The upregulated and downregulated gene responses to DEX were similar in the surgical patients compared to blood donors, except for the GRα response. GRα was not significantly downregulated in response to 1 μM DEX in the PAT1 cohort (Figure 1). Comparisons of GC-induced gene expression were made between surgical patients and blood donors (cohorts PAT1 and BD1). Equal variances between cohorts were observed for all genes, except for the IL1R2 gene (P<0.001). Induced gene expression changes at 1 μM DEX for GILZ, IL1R2, FKBP5, and HLA-DR did not differ between blood donors (BD1) and patients (PAT1). In contrast, there was a significant difference between blood donors and patients for the GRα response to 1 μM DEX (P<0.01).
Evaluation of endogenous control genes
In the blood donors, RPLP0, G6PD, B2M, and cyclophilin, but not ABL, showed a significant correlation between non-stimulated and DEX-stimulated (both low and high) gene expression (r=0.73–0.86, P=0.01–0.05; ABL r=0.54, ns). A significant difference between non-stimulated and DEX-stimulated samples (high DEX, P<0.05) was seen only for G6PD. These results showed that ABL and G6PD were less suitable as endogenous control genes. Details are shown in Table S2.
RPLP0, B2M, and cyclophilin expression was determined in the PAT2 cohort. There was a significant correlation between non-DEX-stimulated preoperative and postoperative gene expression for these three genes (B2M r=0.65, P<0.001; cyclophilin r=0.72, P<0.001; and RPLP0 r=0.84, P<0.0001). RPLP0 had the strongest correlation between pre- and postoperative samples, the smallest mean difference, the smallest standard deviation, and the narrowest confidence interval. Details are shown in Table S3.
Differences in GC-regulated gene expression in response to low and high DEX
Correlations and differences between gene expression change at low and high concentrations of DEX were calculated and analyzed in preoperative samples in the PAT2 cohort. Log(2) levels of DEX-mediated changes in gene expression of GILZ, FKBP5, IL1R2, and HLA-DR in preoperative samples displayed normal distributions. There were moderate to strong correlations between regulation at low and high DEX concentrations (gene expression at low DEX vs high DEX: GILZ r=0.48, FKBP5 r=0.48, IL1R2 r=0.67, and HLA-DR r=0.76, all P<0.001). Furthermore, there were significant differences between GC-induced gene expression at low and high concentrations (all P<0.001). Significantly different but correlated gene expression levels at different concentrations of DEX suggest a dose–response pattern for these four genes. No such pattern was seen for the GRα gene. GC-induced GRα expression deviated significantly from normality at both low and high DEX concentrations (both P<0.05).
In the postoperative samples from the PAT2 cohort, there were no significant deviations from normality at either low or high concentrations of DEX for any of the five genes investigated (all ns). For each gene, there were correlations between induced gene expression at low and high concentrations (gene expression at low DEX vs high DEX: GILZ r=0.52, P<0.05; FKBP5 r=0.76, P<0.001; IL1R2 r=0.78, P<0.001; HLA-DR r=0.56, P<0.01; and GRα r=0.46, P<0.05). For all genes, we saw significant differences between induced expression at low and high DEX concentrations (gene expression at low DEX vs high DEX: GILZ P<0.01; FKBP5 P<0.0001; IL1R2 P<0.0001; HLA-DR P<0.05; and GRα P<0.0001).
GC-regulated gene expression and clinical outcome
Procedure and outcome data for the patients are shown in Table 1. Preoperative and postoperative gene regulation did not significantly vary with age or sex for either concentration of DEX. The correlations between ICU-LOS and preoperative gene expression in response to low DEX were significant for GILZ and GRα (GILZ r=−0.47, P<0.05; GRα r=−0.64, P<0.01; Figure 2A and B), but not for IL1R2, FKBP5, or HLA-DR. In the postoperative samples, there were no significant correlations between ICU-LOS and gene regulation at either concentration. There were no significant correlations between Clavien–Dindo grade and GC-induced gene expression at either DEX concentration in either the pre- or the postoperative samples.
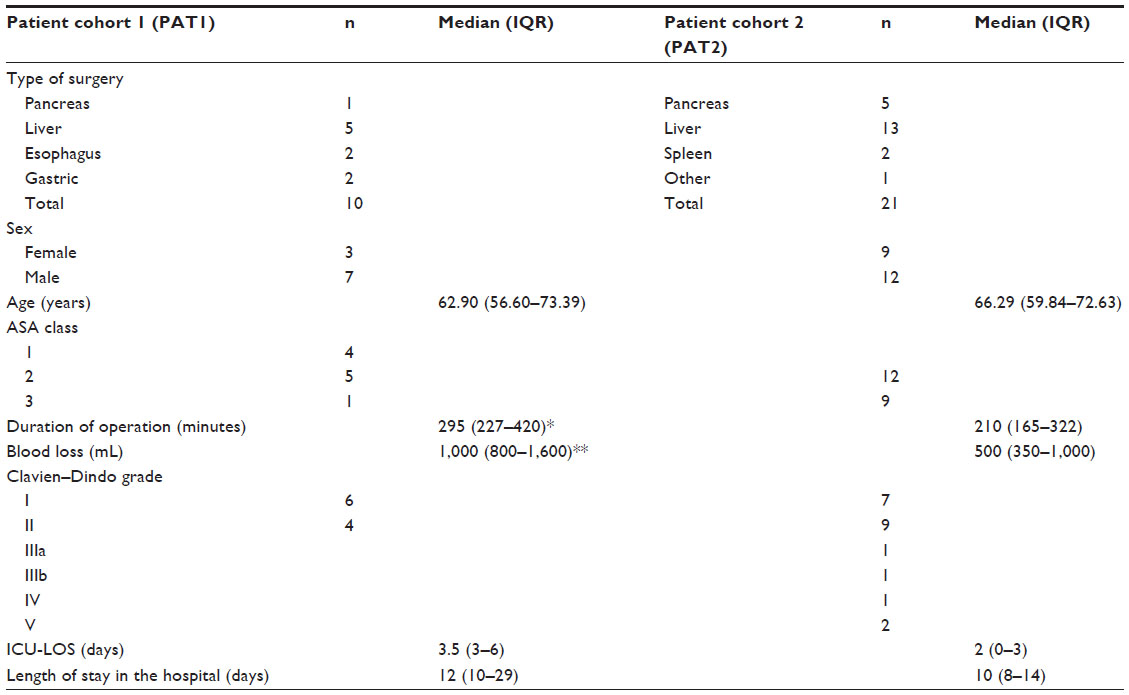 | Table 1 Characteristics of patients, procedures, and outcomes |
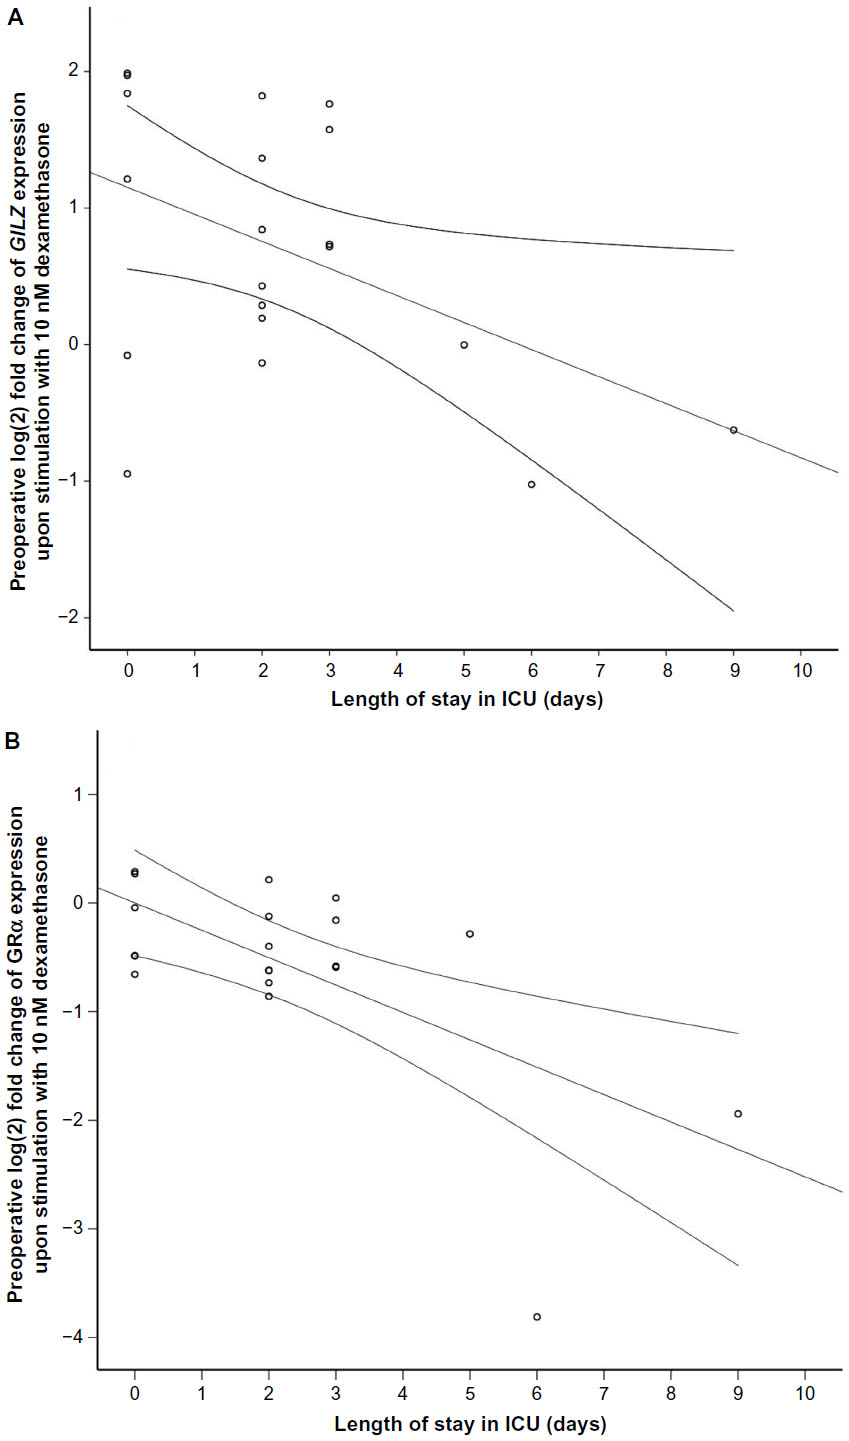 | Figure 2 Correlation between preoperative gene expression of GILZ (P<0.05, A) and GRα (P<0.05, B) in response to 10 nM DEX in peripheral leukocytes from the patient cohort 2 (PAT2) (surgical patients, n=21) and length of stay (days) intensive care unit (ICU). |
There were trends toward correlations between preoperative IL1R2 at low DEX and ICU-LOS (r=−0.42, P=0.06) and Clavien–Dindo grade (ρ=0.44, P=0.051). Additional results are shown in Figures S1 and S2.
GC-regulated gene expression and inflammatory and metabolic markers
Except for C-peptide and non-esterified fatty acids, the systemic concentrations of the inflammatory and metabolic markers were increased after surgery (Table 2). There was no significant difference in serum cortisol between pre- and postoperative samples. In the preoperative samples stimulated with high DEX, the expression levels of HLA-DR and IL1R2 were correlated with preoperative cortisol levels (r=0.50, P<0.05 and r=−0.61, P<0.01, respectively). There were no significant correlations between DEX-induced expression of GILZ, FKBP5, and GRα and serum cortisol levels.
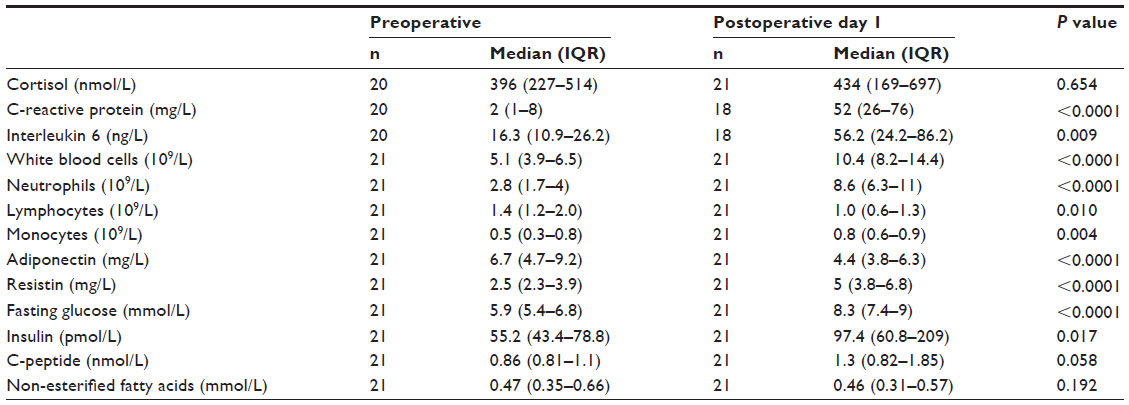 | Table 2 Cortisol and markers of inflammation and metabolism in patient cohort 2 (PAT2) |
Postoperative cortisol, the systemic inflammatory markers (CRP, neutrophil count, and IL-6), and the metabolic markers (glucose, insulin, c-peptide, adiponectin, and resistin) were not significantly correlated to GC-regulation of any of the genes at either concentration in the postoperative samples.
There were no significant correlations of apparent clinical importance between the plasma levels of any of the 21 cytokines investigated postoperatively and preoperative GC regulation of IL1R2, GRα, and HLA-DR at either concentration. Preoperative GILZ expression in samples stimulated with high DEX was correlated to postoperative levels of MIP-1α and TNFα (ρ=−0.48 and −0.505, both P<0.05). Preoperative high-DEX-stimulated FKBP5 expression was correlated with postoperative MIP-1α plasma concentrations (ρ=−0.493, P=0.037). There were no significant correlations between postoperative GC-induced gene expression and postoperative levels of cytokines.
Discussion
We propose an assay for measuring the DEX-induced expression of GC-regulated genes in human peripheral leukocytes as a reflection of GC responsiveness. There were no significant differences between blood donor and patients in the regulation of GILZ, IL1R2, FKBP5, HLA-DR, and GRα expression in response to DEX, although variance of GRα expression was greater in the patients. Preoperative, but not postoperative, GC regulation of the GILZ response was negatively correlated to ICU-LOS and postoperative systemic TNFα and MIP-1 levels.
Our results are consistent with earlier studies of the induced expression of the GILZ and FKBP5 genes in human peripheral leukocytes in response to DEX.5,6 The present study expanded the previously described methodology by investigating additional GC-regulated genes that could be used to describe altered gene regulation more fully in various inflammatory states. We also identified a control gene, RPLP0 that was suitable for both GC stimulation and inflammation. The dose–response pattern in GC-induced gene expression in response to two concentrations of DEX, both with and without inflammation, showed the stability of the assay.
As expected, surgery resulted in a postoperative inflammatory and metabolic response that was shown by increased CRP, IL-6, neutrophils, insulin, and resistin and decreased adiponectin. However, the postoperative regulation of genes previously shown to be strongly regulated by GC (GILZ, IL1R2, FKBP5, HLA-DR, and GRα) was not correlated with the markers of metabolism and systemic inflammation used in the present study. Several mechanisms may explain the lack of significant associations between postoperative gene regulation by GC and the systemic stress responses. It is possible that the genes investigated were not specific to the surgery-induced inflammatory response or that the timing or sensitivity of the assay could not detect changes in GC-induced gene expression in the early phase of postoperative inflammation. Testing this assay at multiple time-points after the onset of inflammation, ie, surgery, might provide deeper insight. Also, further investigation of the optimal duration of DEX incubation is warranted.
Alternatively, greater variations in cell populations within the white blood cells in the postoperative state may have played a role. The white blood cell count and the number of neutrophils were increased to a similar degree after surgery in all patients, but the present study did not determine how GC-regulated gene expression in various subsets of white blood cells was affected by surgery. In future studies, we plan to look at subsets of white blood cells and also evaluate other GC-regulated and inflammation-related genes.
Interestingly, we observed that a stronger preoperative GC-induced expression of GILZ, a gene involved in anti-inflammatory actions, was associated with a shorter ICU stay after surgery as well as with lower postoperative systemic levels of the chemokines TNFα and MIP-1α. TNFα and MIP-1α are early proinflammatory factors released in response to injury; MIP-1α has been shown to be important for inflammation-induced organ injury after hemorrhage and surgical trauma in mice17 and TNFα is involved in the development of postoperative complications.18 Taken together, our results indicate that preoperative GC-regulation of genes involved in anti-inflammation could serve as a risk marker for an adverse outcome after surgery. Furthermore, we observed that a reduced downregulation of the GRα gene in response to DEX before surgery was correlated with a faster recovery after surgery (shorter ICU stay). The interpretation of this finding is complex, since both enhancement and suppression of the inflammatory response by GC have been reported.16
Conclusion
We suggest that this assay could be used to assess GC responsiveness. Alterations in preoperative GC responsiveness ex vivo may reflect a patient’s ability to recover from surgically induced inflammatory stress. These results need to be confirmed in a larger study of surgical patients. The assay also needs to be evaluated in other pathophysiological inflammatory conditions and GC-resistant states.
Acknowledgment
We would like to thank Olivera Werngren for technical assistance with RT-qPCR.
Disclosure
The authors report no conflicts of interest in this work.
References
Annane D, Bellissant E, Bollaert PE, et al. Corticosteroids in the treatment of severe sepsis and septic shock in adults: a systematic review. JAMA. 2009;301(22):2362–2375. | |
Marik PE, Pastores SM, Annane D, et al. Recommendations for the diagnosis and management of corticosteroid insufficiency in critically ill adult patients: consensus statements from an international task force by the American College of Critical Care Medicine. Crit Care Med. 2008; 36(6):1937–1949. | |
Peng YS, Wu CS, Chen YC, et al. Critical illness-related corticosteroid insufficiency in patients with severe acute biliary pancreatitis: a prospective cohort study. Crit Care. 2009;13(4):R123. | |
Stein DM, Jessie EM, Crane S, et al. Hyperacute adrenal insufficiency after hemorrhagic shock exists and is associated with poor outcomes. J Trauma Acute Care Surg. 2013;74(2):363–370; discussion 370. | |
Burnsides C, Corry J, Alexander J, et al. Ex vivo stimulation of whole blood as a means to determine glucocorticoid sensitivity. J Inflamm Res. 2012;5:89–97. | |
Vermeer H, Hendriks-Stegeman BI, van der Burg B, van Buul-Offers SC, Jansen M. Glucocorticoid-induced increase in lymphocytic FKBP51 messenger ribonucleic acid expression: a potential marker for glucocorticoid sensitivity, potency, and bioavailability. J Clin Endocrinol Metab. 2003;88(1):277–284. | |
Vermeer H, Hendriks-Stegeman BI, Verrijn Stuart AA, van Buul-Offers SC, Jansen M. A comparison of in vitro bioassays to determine cellular glucocorticoid sensitivity. Eur J Endocrinol. 2004;150(1):41–47. | |
Baughman G, Wiederrecht GJ, Chang F, Martin MM, Bourgeois S. Tissue distribution and abundance of human FKBP51, and FK506-binding protein that can mediate calcineurin inhibition. Biochem Biophys Res Commun. 1997;232(2):437–443. | |
Schmidt S, Rainer J, Riml S, et al. Identification of glucocorticoid-response genes in children with acute lymphoblastic leukemia. Blood. 2006;107(5):2061–2069. | |
Ayroldi E, Riccardi C. Glucocorticoid-induced leucine zipper (GILZ): a new important mediator of glucocorticoid action. FASEB J. 2009; 23(11):3649–3658. | |
Re F, Muzio M, De Rossi M, et al. The type II “receptor” as a decoy target for interleukin 1 in polymorphonuclear leukocytes: characterization of induction by dexamethasone and ligand binding properties of the released decoy receptor. J Exp Med. 1994;179(2):739–743. | |
Okret S, Poellinger L, Dong Y, Gustafsson JA. Down-regulation of glucocorticoid receptor mRNA by glucocorticoid hormones and recognition by the receptor of a specific binding sequence within a receptor cDNA clone. Proc Natl Acad Sci U S A. 1986;83(16):5899–5903. | |
Pfaffl MW. A new mathematical model for relative quantification in real-time RT-PCR. Nucleic Acids Res. 2001;29(9):e45. | |
Dindo D, Demartines N, Clavien PA. Classification of surgical complications: a new proposal with evaluation in a cohort of 6336 patients and results of a survey. Ann Surg. 2004;240(2):205–213. | |
D’Adamio F, Zollo O, Moraca R, et al. A new dexamethasone-induced gene of the leucine zipper family protects T lymphocytes from TCR/CD3-activated cell death. Immunity. 1997;7(6):803–812. | |
Galon J, Franchimont D, Hiroi N, et al. Gene profiling reveals unknown enhancing and suppressive actions of glucocorticoids on immune cells. FASEB J. 2002;16(1):61–71. | |
Hsieh CH, Frink M, Hsieh YC, et al. The role of MIP-1 alpha in the development of systemic inflammatory response and organ injury following trauma hemorrhage. J Immunol. 2008;181(4):2806–2812. | |
Dimopoulou I, Armaganidis A, Douka E, et al. Tumour necrosis factor-alpha (TNFalpha) and interleukin-10 are crucial mediators in post-operative systemic inflammatory response and determine the occurrence of complications after major abdominal surgery. Cytokine. 2007;37(1):55–61. |
Supplementary materials
Gene Expression Omnibus data
Dataset GSE2842, samples GSM60588–60593.
Chip files for GCOS 1.4 were generated using all probe sets scaled to target signal 100. Expression levels between samples were compared using pairwise comparisons in GCOS:
6–0 hours; 60589 vs 60588, 60589 vs 60591, 60592 vs 60588 and 60592 vs 60591.
24–0 hours; 60590 vs 60588, 60590 vs 60591, 60593 vs 60588, 60593 vs 60591.
Probe sets with change call and signal log ratio ≥1 (fold change ≥2), and signal log ratio ≤−1 (fold change ≤−2) in all comparisons were selected for RT-qPCR.
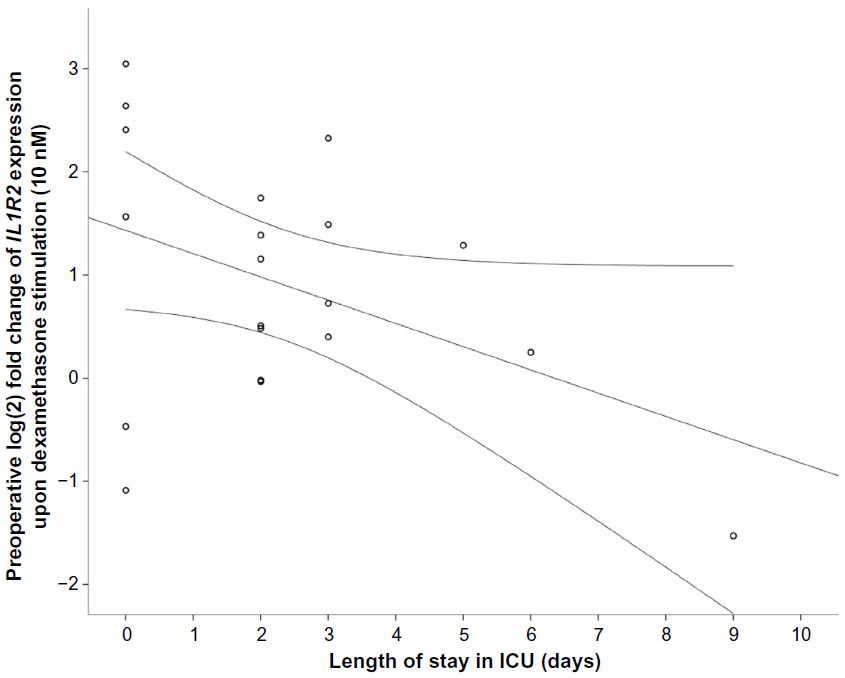 | Figure S1 Correlation between preoperative gene expression of IL1R2 (P=0.06) in response to 10 nM dexamethasone (DEX) in peripheral leukocytes from the PAT2 cohort and length of stay (days) in the intensive care unit (ICU). |
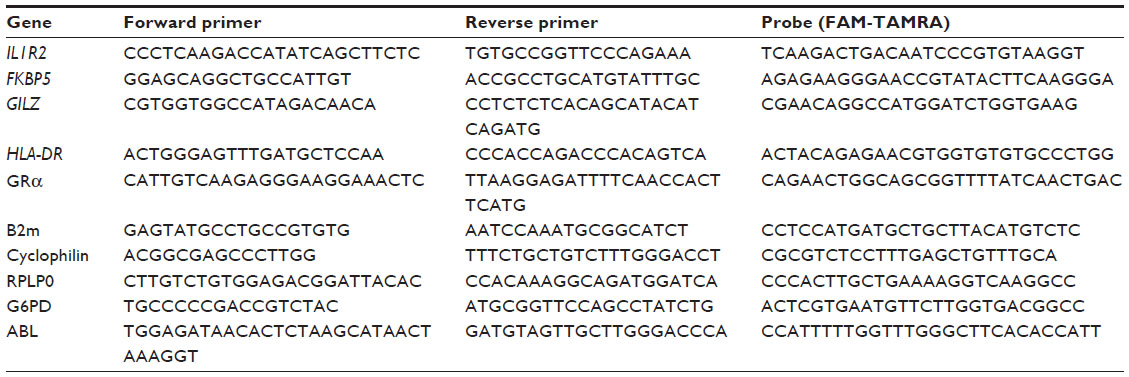 | Table S1 Primer and probe sequences for investigated genes and endogenous control genes |
 | Table S2 Gene expression of candidate endogenous control genes in healthy blood donors (n=9) |
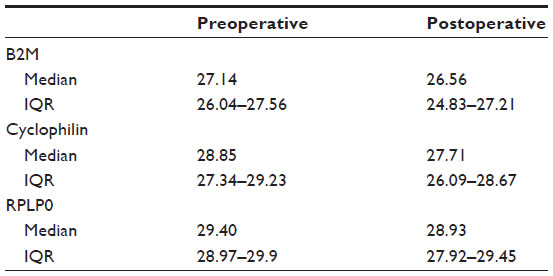 | Table S3 Gene expression of endogenous control genes in surgical patients (n=21) |
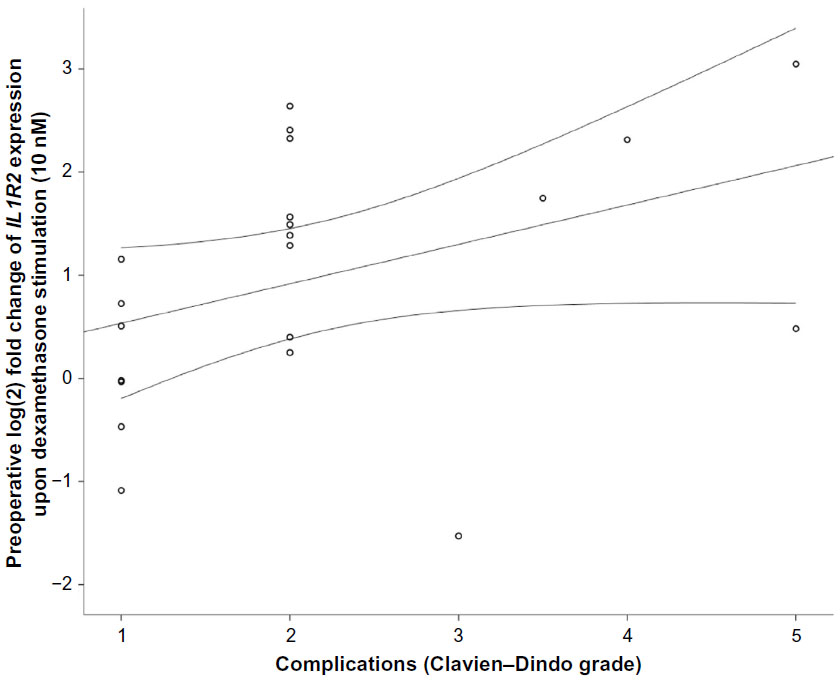 | Figure S2 Correlation between preoperative gene expression of IL1R2 (P=0.051) in response to 10 nM dexamethasone (DEX) in peripheral leukocytes from the PAT2 cohort and Clavien–Dindo grade of complications. |
 © 2015 The Author(s). This work is published and licensed by Dove Medical Press Limited. The full terms of this license are available at https://www.dovepress.com/terms.php and incorporate the Creative Commons Attribution - Non Commercial (unported, v3.0) License.
By accessing the work you hereby accept the Terms. Non-commercial uses of the work are permitted without any further permission from Dove Medical Press Limited, provided the work is properly attributed. For permission for commercial use of this work, please see paragraphs 4.2 and 5 of our Terms.
© 2015 The Author(s). This work is published and licensed by Dove Medical Press Limited. The full terms of this license are available at https://www.dovepress.com/terms.php and incorporate the Creative Commons Attribution - Non Commercial (unported, v3.0) License.
By accessing the work you hereby accept the Terms. Non-commercial uses of the work are permitted without any further permission from Dove Medical Press Limited, provided the work is properly attributed. For permission for commercial use of this work, please see paragraphs 4.2 and 5 of our Terms.