")
Back to Journals » International Journal of Nanomedicine » Volume 10 » Special Issue on diverse applications in Nano-Theranostics
Amperometric urea biosensors based on sulfonated graphene/polyaniline nanocomposite
Authors Das G, Yoon HH, An SSA
Received 10 May 2015
Accepted for publication 8 July 2015
Published 25 August 2015 Volume 2015:10(Special Issue on diverse applications in Nano-Theranostics) Pages 55—66
DOI https://doi.org/10.2147/IJN.S88315
Checked for plagiarism Yes
Review by Single anonymous peer review
Peer reviewer comments 4
Editor who approved publication: Dr Thomas Webster
Gautam Das, Hyon Hee Yoon
Department of Chemical and Biological Engineering, Gachon University, Seongnam, Gyeonggi-do, South Korea
Abstract: An electrochemical biosensor based on sulfonated graphene/polyaniline nanocomposite was developed for urea analysis. Oxidative polymerization of aniline in the presence of sulfonated graphene oxide was carried out by electrochemical methods in an aqueous environment. The structural properties of the nanocomposite were characterized by Fourier-transform infrared, Raman spectroscopy, X-ray photoelectron spectroscopy, and scanning electron microscopy techniques. The urease enzyme-immobilized sulfonated graphene/polyaniline nanocomposite film showed impressive performance in the electroanalytical detection of urea with a detection limit of 0.050 mM and a sensitivity of 0.85 µA·cm-2·mM-1. The biosensor achieved a broad linear range of detection (0.12–12.3 mM) with a notable response time of approximately 5 seconds. Moreover, the fabricated biosensor retained 81% of its initial activity (based on sensitivity) after 15 days of storage at 4°C. The ease of fabrication coupled with the low cost and good electrochemical performance of this system holds potential for the development of solid-state biosensors for urea detection.
Keywords: electrochemical deposition, sulfonated graphene oxide, urease
Introduction
Research on urea sensors has flourished over the years owing to the significance of these devices in various fields such as clinical diagnosis, environmental monitoring, and agro-food analysis.1 A number of well-established methods such as spectroscopic, colorimetric, and chromatographic techniques have been widely used for urea detection.2–4 However, tedious sample preparation restricts their applicability for rapid on-site monitoring. Electrochemical detection using enzymatic biosensors represents a reliable and feasible technique for laboratory-scale detection because of their simplicity, good sensitivity, high selectivity, and low fabrication cost.5 Moreover, the fabrications of these biosensors are facile and can be scaled down without significantly affecting their performance.6,7 Urea biosensors are based on the urease (Urs) enzyme, which catalyzes the hydrolysis of urea generating ammonium and bicarbonate ions. These species influences the pH of the surrounding environment. In particular, the ammonium ion (NH4+) in traces can be easily identified by employing a specific transducer.8,9
Polyaniline (PANI) is one of the most frequently investigated intrinsically conducting polymers for biosensor applications owing to its good electrical conductivity, unique redox chemistry, and biocompatibility.10–12 In the case of urea biosensors, the electrochemical signal is generated by the association of PANI with NH4+ liberated during urea hydrolysis by Urs. However, PANI exhibits deteriorating electrochemical properties at higher pH (>4),13 which limits its applicability in cases where neutral or slightly basic pH is required, such as in bioelectrochemistry. For this reason, considerable efforts have recently been devoted toward the adaptation of PANI to work in neutral or higher pH conditions. To maintain PANI as electrochemically active at higher pH, self-doping14,15 and external doping16 have been used as the preferred approaches.17 Self-doped structures obtained by direct sulfonation of PANI usually enhance its electroactivity, but at the cost of a decrease in conductivity. The use of external dopants such as Nafion, is limited by the high cost and the swelling of the membrane in water; these factors may limit the use of external dopants in sensor fabrication. Taking into account all the above issues, it is believed that conductive materials could act as interesting dopants for PANI, with graphitic materials emerging as a good contender.18
Graphene is used in electrochemical sensors or biosensors owing to its unique characteristics such as good electrochemical properties, excellent mechanical strength, biocompatibility, and ease of fabrication.18–21 The high surface area of the graphitic network structure leads to good electronic transport property and excellent electrocatalytic activity.22 Moreover, the electrochemical properties of graphene can be effectively modified by integrating it with other nanostructures to produce versatile electrochemical sensing platforms.23–26
Therefore, graphene/PANI composite materials would effectively combine the advantages of the individual components, such as the high electron mobility of graphene with the selectivity, conductivity, and electrochemical reversibility of PANI, meeting most of the requirements for their use as sensors.27 Recently, it has been demonstrated that reduced graphene oxide (GO) acts as a counterion for PANI.28 Bai et al29 observed high conductivity, good electrocatalytic activity, and stability for a composite of sulfonated graphene (SG) oxide (SGO) and PANI. However, no previous reports on the application of SG-PANI nanostructures for urea biosensing have been published. Herein, we investigate the use of a SG-PANI composite as a matrix for Urs immobilization and electrochemical sensor properties for urea.
We report the sulfonation of GO with 2-ethane-amino sulfonic acid (AESA) and the fabrication of biosensors using SG-PANI composite. The present investigation also focuses on the growth of PANI and subsequent doping using SG. The final objective of the study is to utilize the SG-doped PANI composite for urea biosensing. The SG-PANI composites are expected to show good electroanalytical performance for urea detection.
Materials and methods
Urs (EC 3.5.1.5, from jack beans, 15–50 U/mg; Sigma-Aldrich Co., St Louis, MO, USA) was dissolved in phosphate-buffered saline (PBS) (pH 7.4) for immobilization onto the electrode matrix. Graphite powder and aniline was purchased from Sigma-Aldrich Co. N-hydroxysuccinimide (NHS), and N-(3-dimethylaminopropyl)-N′-ethylcarbodiimide hydrochloride (EDC) were procured from Sigma-Aldrich Co. Dipotassium hydrogen phosphate and potassium dihydrogen phosphate were purchased from JUNSEI (Kyoto, Japan). All the other reagents were of analytical grade.
Indium tin oxide (ITO) glass (<20 Ohm/sqr) was used as a base electrode. The ITO glass was cut into a rectangle of 5 mm width and 20 mm length. The working area of the ITO glass for the electrochemical tests was controlled to 0.25 cm2 using a masking tape.
Preparation of SGO, and SG-PANI composites, and enzyme electrodes
GO was prepared by the modified method of Hummers and Offeman.30 Briefly, graphite powder (2 g) was dispersed in 35 mL of H2SO4 (98%) under vigorous stirring for 2 hours. The temperature of the reaction mixture was maintained below 20°C, and 6 g of KMnO4 was added to this dispersion in aliquots. The reaction was then allowed to proceed at 35°C for 4 hours in an oil bath. Then, 90 mL of deionized (DI) water was added to the above solution, and the stirring was continued for another 1 hour. The dark brown suspension obtained was treated with dropwise addition of 30% H2O2 until the solution turned yellowish. Finally, the resulting GO suspension was centrifuged and was washed repeatedly with HCl solution (5%). A stable dispersion of the purified GO in DI water (1 mg/mL) was attained by ultrasonication and stored for further use.
The sulfonation of GO was carried out by covalent attachment between the carboxylic groups of GO and the amine group of AESA.31,32 NHS (1.71 g) and EDC (2.85 g) were added to 50 mL of GO dispersion in DI water (10 mg/mL) at 0°C, and the mixture was stirred for 2 hours. Then, 0.5 g of AESA was added to the above reaction mixture and stirred overnight at room temperature (RT) (Figure 1). The obtained GO–SO3H (ie, SGO) was washed and dispersed in water and then stored at RT for further use.
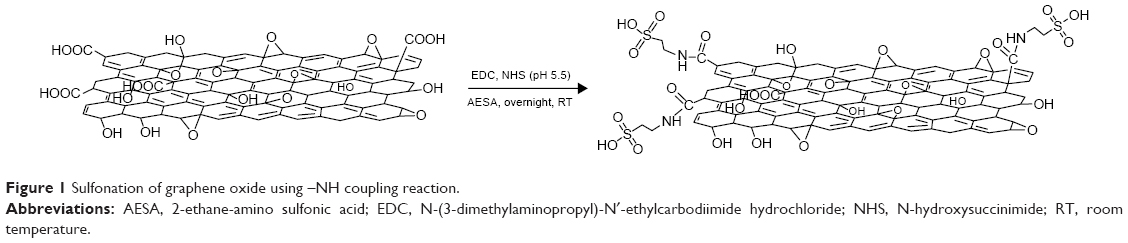 | Figure 1 Sulfonation of graphene oxide using –NH coupling reaction. |
The electrochemical deposition of the SG-PANI composite was performed under ambient conditions in a three-compartment cell using a potentiostat-galvanostat (Model: VSP, BioLogic-Science Instruments, 38640 CLAIX, France). ITO glass (area =0.25 cm2), a Pt wire, and Ag/AgCl were used as the working, counter, and reference electrodes, respectively. The potentials were referred to Ag/AgCl (3 M NaCl). A precalculated amount of SGO (1 mg/mL) was dispersed in DI water, to which 0.1 M aniline and 1 M HCl were added successively, and then the whole solution was sonicated for 10 minutes and stirred vigorously at RT overnight. During this time, aniline formed the anilinium ion which is adsorbed on the SGO sheets via electrostatic or van der Waals interactions. The electrodeposition was then performed for ten cycles with a sweeping potential between −0.7 and +1.2 V vs Ag/AgCl at a scan rate of 100 mV/s. The deposited film was repeatedly rinsed with DI water and methanol to wash away the unreacted adsorbed monomers, after which the nanocomposite was dried in a vacuum oven at RT for 24 hours before fabricating the enzyme electrode.
The enzyme electrode was prepared as follows: 20 μL of Urs (1 mg/mL of PBS, pH 7.4) was dripped onto the SG-PANI-coated ITO glass; then, 0.1% glutaraldehyde was spread over Urs. The prepared electrode is henceforth denoted as ITO/SG-PANI/Urs.
Analysis
The Fourier-transform infrared (FTIR) spectra of the samples were recorded by an FTIR spectrometer (JASCO FT-IR 300E) using KBr pellets. The Raman spectra were measured with a LabRam Aramis Raman spectrophotometer employing an Ar-ion laser (514.532 nm). The binding energy plots of the samples were obtained from an X-ray photoelectron spectroscopy spectrophotometer (K-alpha; Thermo Fisher Scientific, Waltham, MA, USA) using a monochromated Al X-ray source (Al Kα line: 1486.6 eV). The morphology of the samples was studied by a scanning electron microscope (Hitachi S-4700; Hitachi Ltd., Tokyo, Japan). Prior to the scanning electron microscopy (SEM) analysis, the samples were sputtered with a thin layer of platinum using a Balzers Union SCD 040 sputtering apparatus.
The electrocatalytic activity of ITO/SG-PANI/Urs was evaluated by cyclic voltammetry (CV) using a potentiostat (Model: VSP, BioLogic-Science Instruments, 38640 CLAIX, France). A conventional three-electrode cell assembly was used for the electrochemical measurements. ITO/SG-PANI/Urs was used as the working electrode, whereas Ag/AgCl and a Pt wire were used as reference and counter electrodes, respectively. A small magnetic bar provided the convective transport. All the voltammograms were obtained in PBS (pH 7.4) at RT under ambient conditions.
Results and discussion
Synthesis and morphology of SG-PANI composite
The SG-PANI nanocomposite was synthesized by a facile approach using one-step electrochemical oxidative polymerization (Figure 2) at a cyclic potential ranging from −0.7 to +1.2 V. The electrochemical method offers the advantage of a rapid synthesis of PANI. After the first cycle, which is the initiation period, the current grows very rapidly due to the oxidation of the aniline monomers and oligomers. The aniline polymerization is an autocatalytic process: after the initial cycle, the growth of the polymers is sustained by the generated radical cations. On subsequent sweeps, the anodic peaks are shifted in the anodic direction and the cathodic peak in the cathodic direction, with a simultaneous increase in the current. The shift of the peaks is consistent with the ohmic contribution to the overpotential. This electrochemical behavior reflects the deposition of the composite film onto the ITO surface. The deposited film exhibits a smooth surface and good adhesion to the ITO surface. The morphology of both the as-prepared SGO and the nanocomposite film deposited on ITO was studied by SEM. The SEM image of SGO exhibited a well-dispersed, layered-type structure (Figure 3A). Owing to the oxygenated functionalities on its basal planes and edges, SGO represents an attractive platform for the association of different materials. The dispersion of aniline prior to electrochemical polymerization is crucial for the association of the PANI nanofibers onto the graphitic sheets. The anilinium ion is adsorbed onto the graphitic surface through electrostatic interaction with the oxygenated functional groups. The number of cycles or deposition time is crucial to control the growth of PANI and its amount in the nanocomposite. The formation of the observed nanofiber-like morphology of PANI (Figure 3B) can be described by the seedling growth process.29 At the initial polymerization stage, oxidation of anilinium ions takes place, leading to the formation of seeds. During the course of the polymerization, elongated structures of PANI are formed from these seeds.29 The reduction of SGO during cycling is assumed to be the driving force for the simultaneous deposition of these nanostructures. The nanofiber-like structure of PANI (Figure 3B and C) exhibited diameters of ~88±5 nm and lengths of ~0.5–1.0 μm. In addition, some irregular structures (particulate or spherical) were seen along with the nanofibers (Figure 3C); similar mixed morphology of PANI was also reported by Zhang et al.33 Even though some reports on the synthesis of SG-PANI composites have been published,34,35 their electrochemical synthesis has been rarely investigated. The SG-PANI mixed morphology differs from that of PANI synthesized by electrochemical routes, which consists exclusively of nanofibers.36 The shorter polymerization time might be responsible for this difference. Importantly, SGO was reduced to SG in the applied potential range without requiring any additional reducing agent. The reduction of SGO to SG during the deposition is beneficial for the formation of an extended conjugated structure at the PANI/SG interface.37,38 Moreover, the cross-sectional image of ITO/SG-PANI denotes a well-integrated compact structure. Although, direct evidence of an intercalated morphology was not obtained, we assume that the PANI nanofibers probably reside on the surface and between the layers, hence giving rise to the possibility of an intercalated structure (Figure 3D). During the polymerization of aniline, the π-π stacking interaction between the oligomers and the basal planes of SG favored the organization of PANI onto the SG surface (Figure 4). It is expected that such porous and integrated structure with an enhanced surface area would be beneficial for mass transport, thus maximizing the efficiency of the biosensors.39
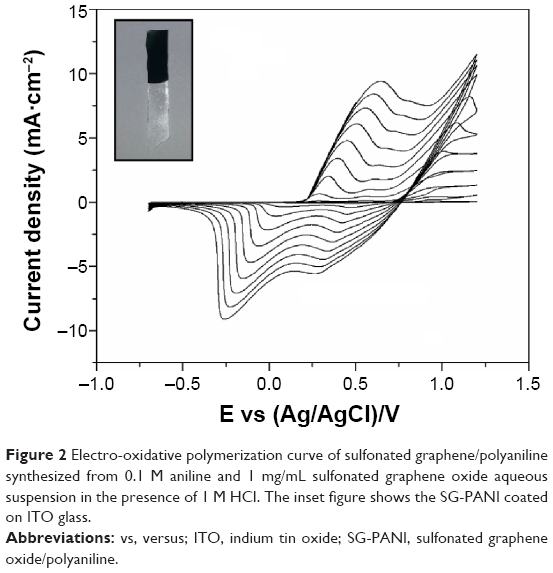 | Figure 2 Electro-oxidative polymerization curve of sulfonated graphene/polyaniline synthesized from 0.1 M aniline and 1 mg/mL sulfonated graphene oxide aqueous suspension in the presence of 1 M HCl. The inset figure shows the SG-PANI coated on ITO glass. |
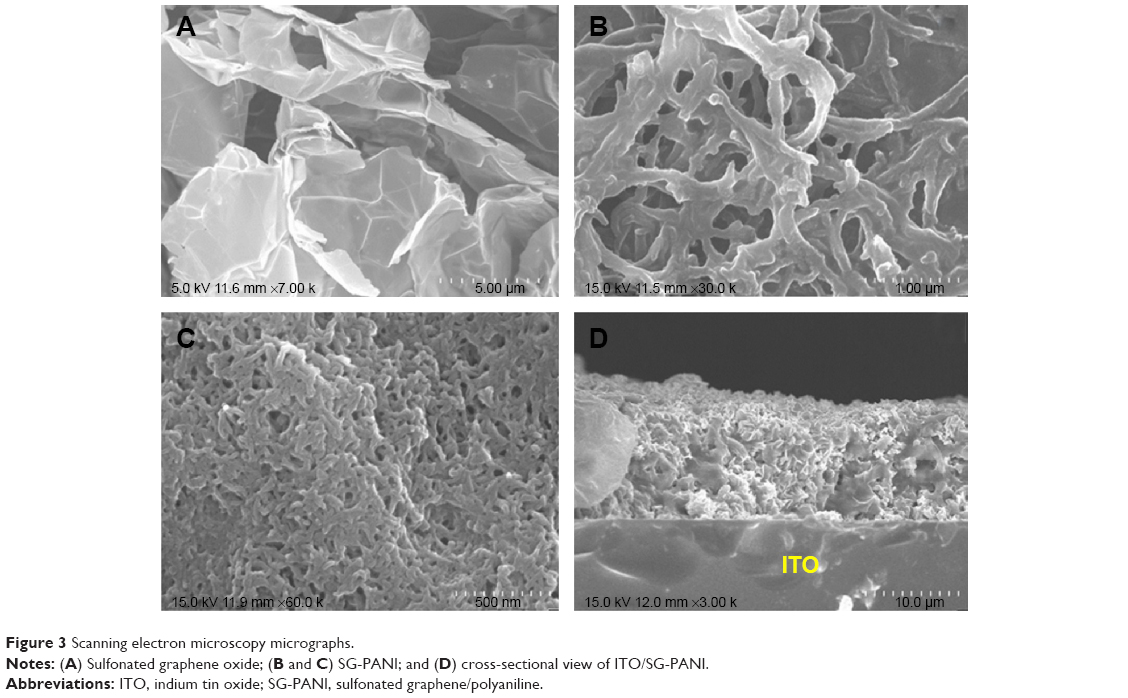 | Figure 3 Scanning electron microscopy micrographs. |
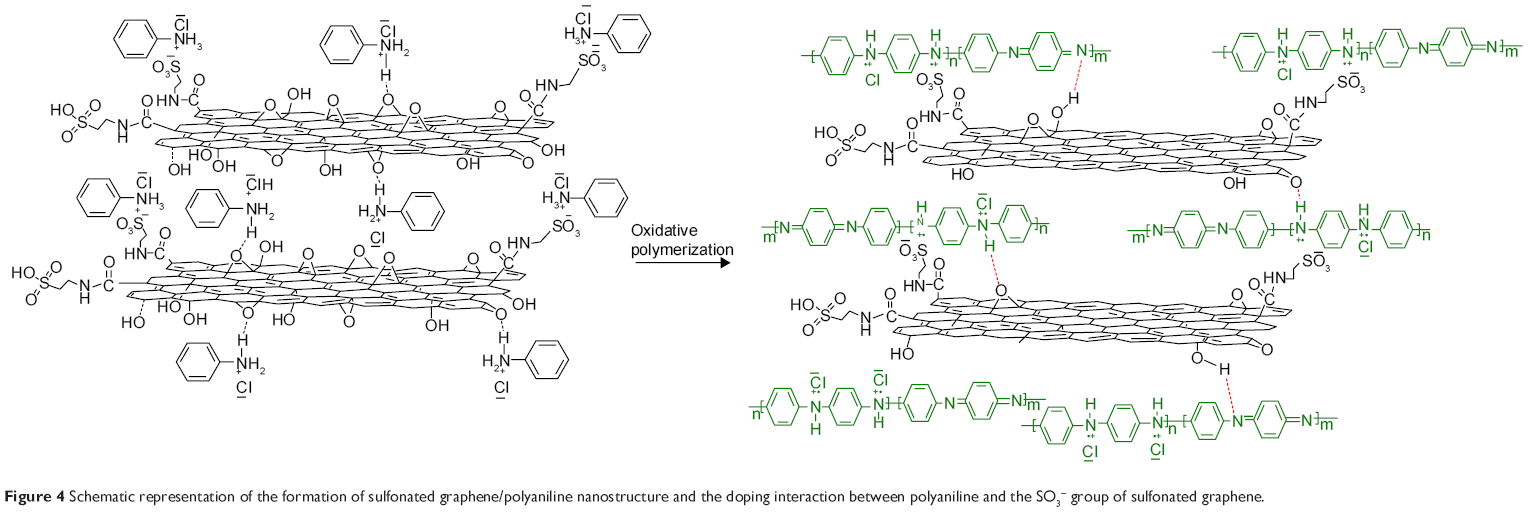 | Figure 4 Schematic representation of the formation of sulfonated graphene/polyaniline nanostructure and the doping interaction between polyaniline and the SO3− group of sulfonated graphene. |
Characterization of GO, SG, and SG-PANI composites
The FTIR spectra of the prepared GO, SGO, and SG-PANI are shown in Figure 5. The spectrum of GO reveals the presence of –C=O (υC=O at 1,727 cm−1), C–O–C (υC–O–C at 1,225 cm−1), and C–O (υC–O at 1,050 cm−1) functional groups.34 The band observed at 1,620 cm−1 was due to the unoxidized graphitic domains. Sulfonation resulted in the attenuation of the bands at 1,620, 1,225, and 1,050 cm−1 in the spectrum of SGO. The appearance of band at 1,030 cm−1 (υS–O) confirms the presence of SO3− group.35 Compared to SGO, several new bands were detected in the spectrum of SG-PANI, such as the stretching vibrational bands corresponding to C=C groups in the quinoid (υC=C at 1,577 cm−1) and benzoid (υC=C at 1,493 cm−1) moiety. The characteristics C–N stretching vibration (υC–N at 1,300 cm−1) and C–H in-plane bending vibration at 1,142 cm−1 were also visible in the spectrum of SG-PANI.34 The observation of C=C stretching vibrations corresponding to the quinoid and benzoid rings in SG-PANI suggests a greater degree of conjugation, originating from the ordered structure of PANI nanofibers, as well as from the doping effect of the –SO3H groups of SG on PANI.34,35 The intensity of the C=O stretching band was observed to decrease in the spectrum of SG-PANI, indicating the reduction of SGO during the electrochemical oxidative polymerization.
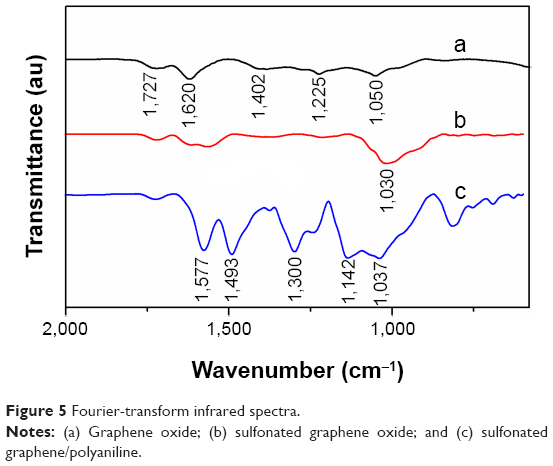 | Figure 5 Fourier-transform infrared spectra. |
The Raman spectra of GO, SGO, and SG-PANI are shown in Figure 6. The Raman spectra show two characteristic peaks centered approximately 1,351 and 1,594 cm−1, corresponding to the D band due to a breathing mode of κ-point photons of A1g symmetry, and to the G mode originated from the first-order scattering of E2g phonons by the sp2 carbon of GO, respectively.40 The ratio between the intensity of D band (ID) to G band (IG) increased from 0.92 for GO to 1.02 for SGO, which indicates a decrease in the sp2 carbon domain size. Compared to GO, in the case of the SGO, the positions of the D and G bands shifted to 1,345 cm−1 and 1,598 cm−1 (Figure 6A), respectively. The shift of the D and G bands in SG-PANI denotes lattice distortion of graphene in the presence of PANI.41 Several additional peaks were observed for SG-PANI (Figure 6B) such as the peak at 1,266 cm−1 due to the C–H bending vibration of the benzoid ring, at 1,174 cm−1 corresponding to the C–H bending of the quinoid ring, and the peaks at 1,041 and 1,000 cm−1 corresponding to C–H bending of the quinoid ring and to the C–N+ stretching of the bipolaron and polaron structure of PANI, respectively.41–43 The appearance of such peaks indicates the formation of an emeraldine salt-type structure of PANI on SG. The spectrum of the SG-PANI composite included bands corresponding to both individual components in good agreement with the FTIR results.
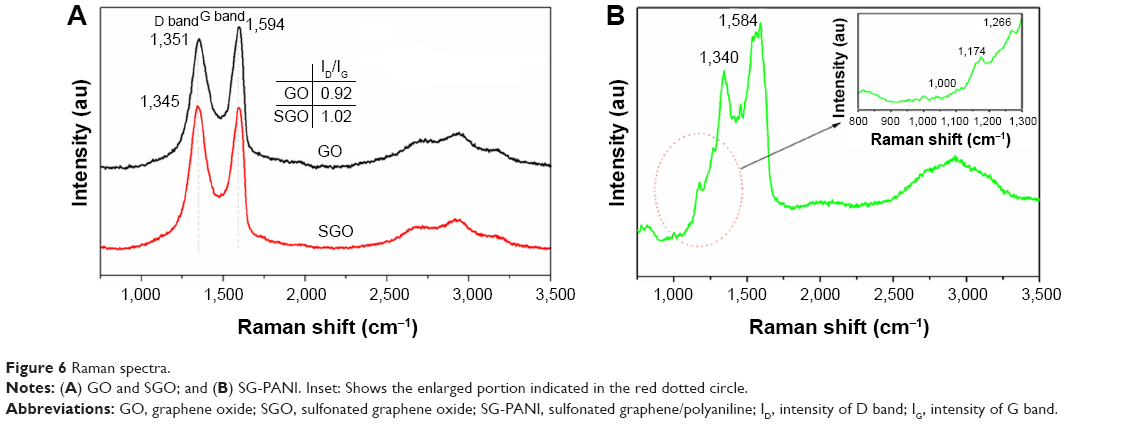 | Figure 6 Raman spectra. |
X-ray photoelectron spectroscopy was also used to assess the structural properties of GO and SGO sheets. The binding energy plot is shown in Figure 7; GO exhibits binding energies at approximately 532 eV for O 1s and 284.9 eV for C 1s. In addition, the plot for SGO shows two new peaks at approximately 401 eV and 169 eV, which correspond to the N 1s and S 2p orbitals.44 The above observations confirm the covalent attachment of AESA onto the graphitic sheet via NHS- and EDC-assisted coupling reaction.45
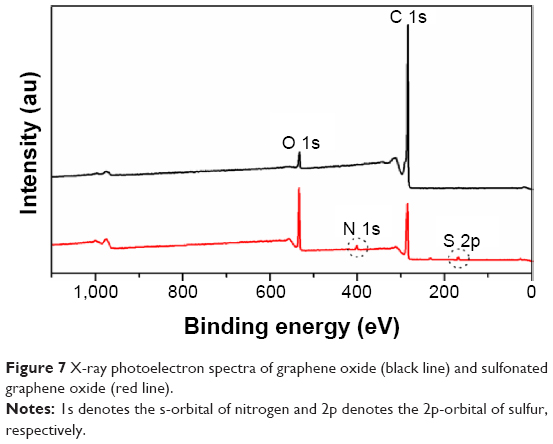 | Figure 7 X-ray photoelectron spectra of graphene oxide (black line) and sulfonated graphene oxide (red line). |
It can thus be concluded that the electrochemical oxidative polymerization does not only deposit SG-PANI onto ITO, but also helps in the reduction of the oxygenated surface groups of SGO, as inferred through the FTIR analysis.
Electrochemical properties
The electrochemical properties of the SG-PANI electrode were studied using CV. Figure 8 shows the cyclic voltammogram of ITO/SG-PANI recorded in 1 M HCl, and that of ITO/SG-PANI/Urs with and without 10 mM urea (PBS, pH 7.4). The cyclic voltammogram of ITO/GO and ITO/SGO were also recorded in PBS and in 10 mM urea (PBS, pH 7.4), respectively. However, no significant differences were observed in the voltammogram (Figure 8B) for the ITO/GO and ITO/SGO in PBS and urea, indicating that GO and SGO played no role in oxidation of urea. Two pairs of redox peaks were distinctly visible for ITO/SG-PANI when the CV was measured in the presence of 1 M HCl (Figure 8A), which is in agreement with earlier published reports.46,47 These peaks correspond to the variable oxidation states of PANI. The peaks merged upon increasing the pH of the medium, as shown in Figure 8Be and Bf. Tian et al46 reported that the merging of the peaks usually occurred at pH >5. PANI has been reported to lose its electrochemical activity in the neutral or basic medium.48 However, with a neutral medium, the ITO/SG-PANI/Urs biosensor showed a stable electrochemical behavior in the cyclic potential range between −0.2 and +0.4 V, due to the doping effect of SG. The CV of the SG-PANI biosensor can be traced to a visibly distinct redox pair, ie, an oxidation peak of ~64 mV and a corresponding reducing peak approximately −93 mV in PBS. This peak is a combination of two peaks generally observed in an acidic medium, corresponding to the transitions of leucoemeraldine and emeraldine and between the emeraldine and pernigraniline redox states of PANI.49 The electrochemical activity of the SG-PANI electrode is thus promising considering the practical applications as the bioactivity of the enzyme is denatured at lower pH (<6). A similar observation was also reported by Liu et al for PANI/poly(aminobenzenesulfonic acid)-modified single-walled carbon nanotubes prepared by the layer-by-layer method.47 The extension of the electroactivity of PANI to a medium of pH 7.4 is indicative of the doping influence on the SO3− groups of SG. Figure 4 represents the possible transformation of the doped PANI structure under this condition. Figure 8B shows that in the presence of urea, the intensity of the anodic and cathodic peaks increases, with a simultaneous shift in the peak potential, ie, the oxidation peak potential shifts to 107 mV and the corresponding reduction peak potential to −47 mV, with a peak-to-peak separation (ΔEp) potential of ~66 mV. The low ΔEp indicates a very fast electron transfer, as generally observed for one-electron systems.50,51
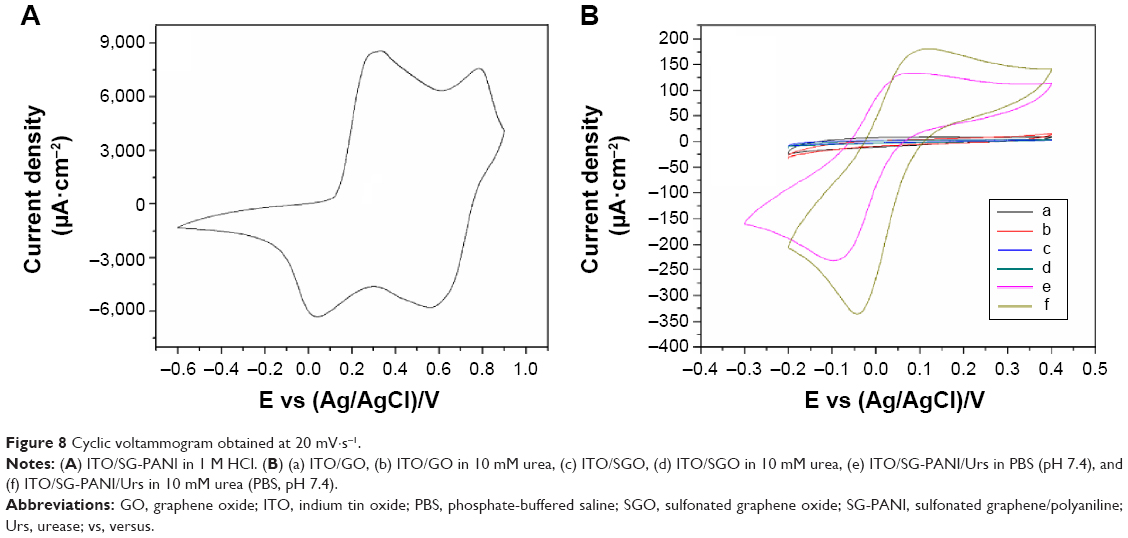 | Figure 8 Cyclic voltammogram obtained at 20 mV·s−1. |
In most previous instances of urea biosensors, polymer electrolytes with negative ions (such as SO3−, and COO−) were used as the doping counter ion;25 although the reported structures exhibited sustained electroactivity, the lack of conductivity and the solubility of the polymer electrolytes in aqueous media lead to subsequent performance degradation. In contrast, the graphitic network structure of graphene provides better structural support and stability (due to its high modulus and strength) and opens the possibility to obtain in situ-generated hybrid nanostructures. In addition, in order to achieve better electrochemical performance, the free movement of the electrons within the structures is also crucial. The complexation of the SG and PANI through the formation of GSO3−PANI+ structure can facilitate easier charge transfer and enhance the conductivity due to the reduce ion intercalation distance.52 Furthermore, the SG-PANI-based biosensor does not exhibit any significant variation in its redox properties during repeated cycling (Figure 9), which highlights the significant long-term stability and preservation of its electrochemical properties.
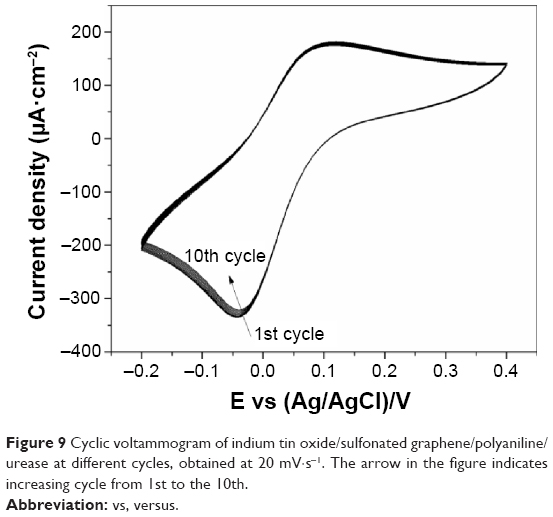 | Figure 9 Cyclic voltammogram of indium tin oxide/sulfonated graphene/polyaniline/urease at different cycles, obtained at 20 mV·s−1. The arrow in the figure indicates increasing cycle from 1st to the 10th. |
The variation of the current as a function of scan rate in 10 mM urea (0.1 M PBS, pH 7.4) is shown in Figure 10. The peak current exhibited a linear increase with the square root of the scan rate (inset of Figure 10), indicating a diffusion-controlled redox process. Furthermore, with increasing scan rate, the anodic peak potential shifted to a more positive potential, whereas the cathodic potential shifted in the reverse direction; this is due to the increase in the electrode resistance at high scan rates.28 The Nernstian response for the adsorption and desorption of ammonia at the interface can be identify by the Randles–Sevcik method as described in Equation 1.
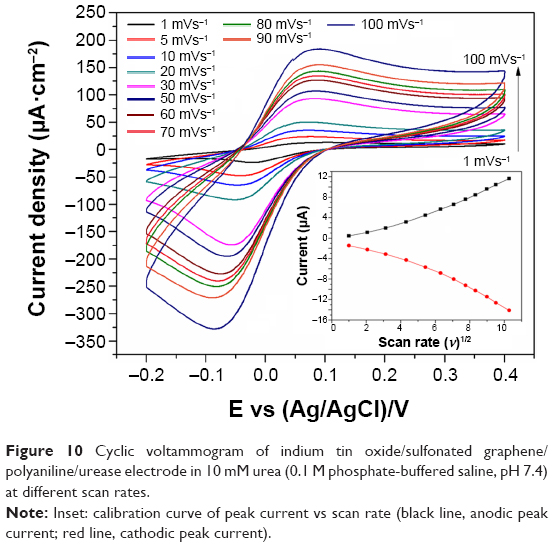 | Figure 10 Cyclic voltammogram of indium tin oxide/sulfonated graphene/polyaniline/urease electrode in 10 mM urea (0.1 M phosphate-buffered saline, pH 7.4) |
Ip =2.69 ⨯105 n3/2 AD1/2 v1/2c | (1) |
where Ip, A, D, v, n, and c denote the peak current, area of the electrode (0.25 cm2), diffusion coefficient, scan rate, electron stoichiometry, and concentration, respectively. Based on Equation 1, the slope of Ip vs square root of scan rate (v1/2) plot (inset of Figure 10) was used to estimate a D value of 1.058×10⁻⁷ cm2·s−1.
Amperometric response
The amperometric response of the ITO/SG-PANI/Urs biosensor was analyzed through the current responses to varying urea concentration (0.12–20 mM) for a definite period of time (Figure 11A). The calibration plot (Figure 11B) indicates a broad linear range (0.12–12.3 mM), a correlation coefficient of 0.997, and a detection limit of 0.05 mM (0.140 mg/dL), based on the signal to noise ratio of ~3 (Figure 11C). A sensitivity of 0.85 μA·cm−2·mM−1 was obtained for the biosensor from the slope of the current/urea concentration calibration curve after triplicate measurements. The ITO/SG-PANI/Urs biosensor showed a rapid response to the change in urea concentration with a response time of ~5 seconds. The instantaneous response of the biosensors can be attributed to the quick diffusion of the NH4+ ions produced during urea hydrolysis toward the PANI surface through the large electrode/electrolyte interface. The porous structure of the biosensor allows low-barrier translational mass diffusion of the ionic species, which results in better utilization of the active sites of the enzyme (Figure 12). The electrochemical signal is generated by the SG-PANI film due to the association between graphene-SO3− and NH4+ to form graphene-SO3−NH4+ (Figure 12), which causes dissociation of NH4+ into NH3 and H+. The proton liberated in this process protonates the imine unit of PANI, generating a radical cation (polaron/bipolaron structure). The interconnected network of PANI nanofibers on the graphitic structure ensures a faster transfer of the electrons, resulting in a fast response time (~5 seconds) for the biosensors compared to other reported values of doped intrinsically conducting polymers (Table 1). It is important to mention that the measured sensitivity was adequate, considering that the urea levels present in the human serum are approximately 1.7–8.3 mM.53
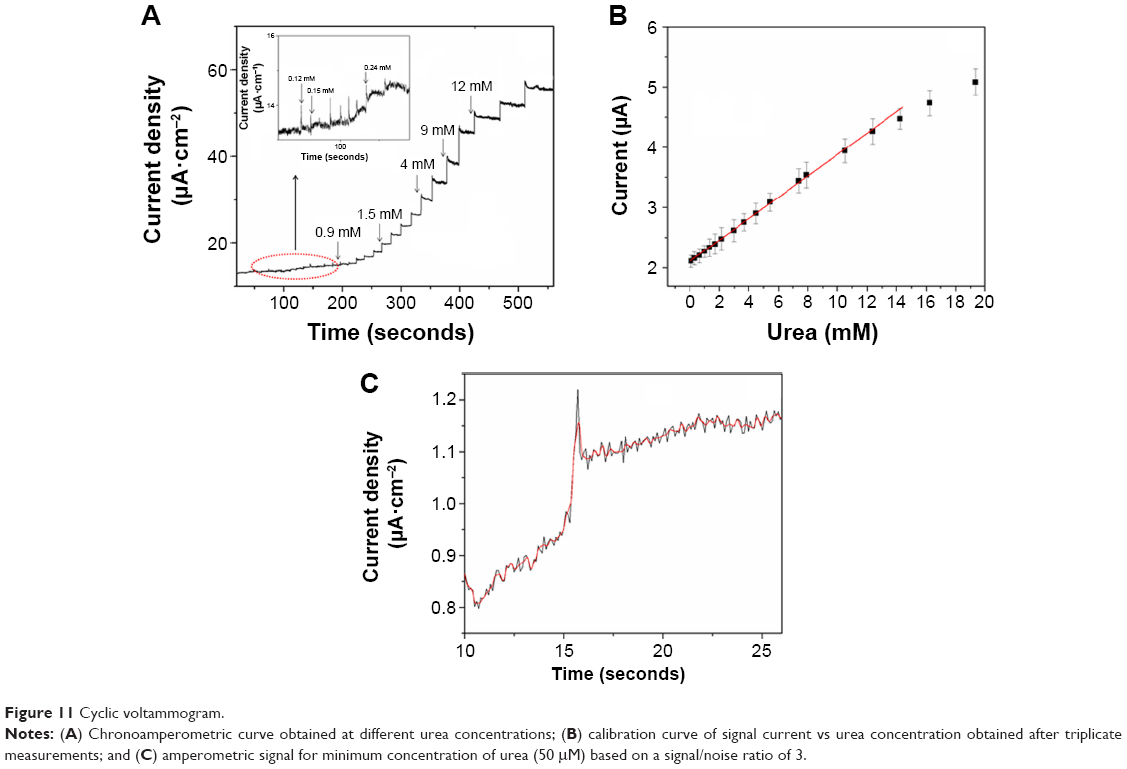 | Figure 11 Cyclic voltammogram. |
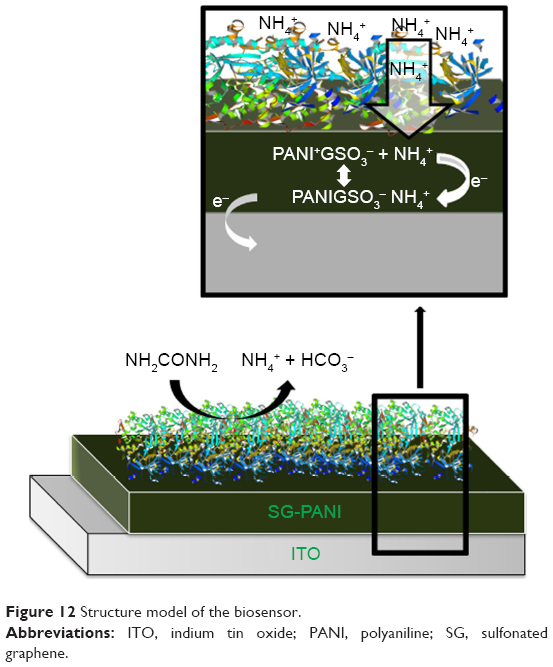 | Figure 12 Structure model of the biosensor. |
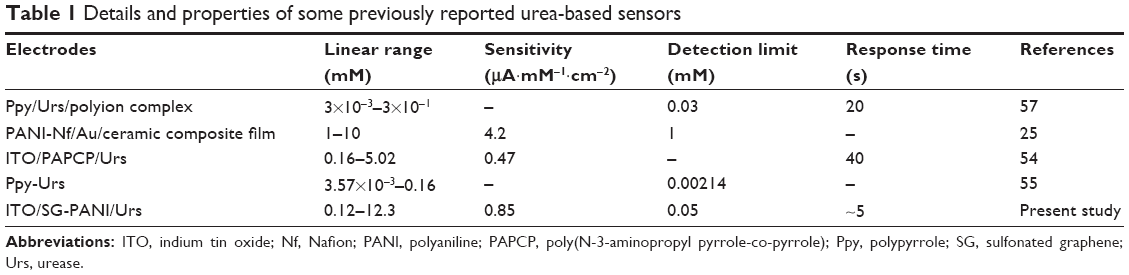 | Table 1 Details and properties of some previously reported urea-based sensors |
The Michaelis–Menten coefficient (KMapp) of the immobilized enzyme was determined from the Lineweaver–Burk (Equation 2) plot of inverse of peak current (1/I) and urea concentration (1/S) (Figure 13). A lower KMapp value, which indicates high affinity of Urs to the urea analyte, is generally desirable.
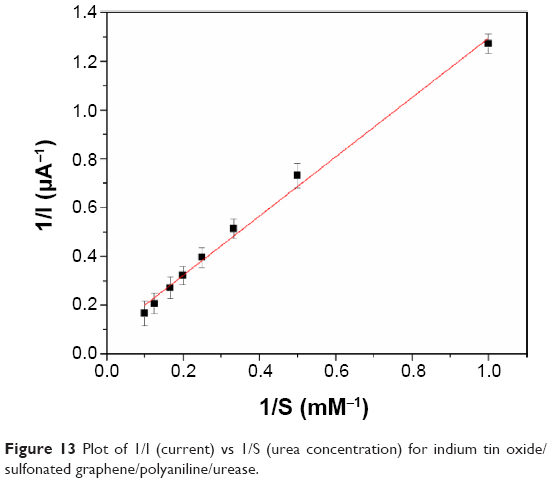 | Figure 13 Plot of 1/I (current) vs 1/S (urea concentration) for indium tin oxide/sulfonated graphene/polyaniline/urease. |
|
|
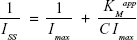
where Iss is the steady-state current after addition of urea, Imax is the maximum current, and C is the urea concentration. The KMapp evaluated by Equation 2 was 1.53 mM which is comparatively higher than some of the previously reported values.54–56 The low value of KMapp may result from two facts: first, the electrode structure as seen in the SEM images exhibits densely distributed pores, which might favor the conformational rearrangements of the enzymes; second, the high surface area of the nanodimensional electrode material enables a more efficient attachment of Urs onto the electrode.57
The electrode retains 81% of its initial activity after 15 days of storage at 4°C which is higher than the value reported in some of the earlier works.58 As the amine nitrogen of conducting PANI has been observed to show good binding properties for biological molecules,59,60 SG-PANI can bind Urs, restricting its overall movement, which may result in effective immobilization and stabilization of the enzyme without requiring additional entrapment.
Real sample analysis and interference study
The feasibility of the sensor to analyze urea in real sample was evaluated for urine collected from a normal person. Prior to analysis, urine was first filtered and then diluted in the ratio of 1:100 in PBS buffer. Different concentration of urea was added to the diluted urine sample and the response of the electrode was recorded. The ITO/SG-PANI/Urs biosensor demonstrated good recovery for the different concentration of urea in urine (Table 2). In addition, the amperometric response of the biosensor was examined in the presence of some common interfering agents (0.1 mM in PBS pH 7.4) such as L-ascorbic acid, creatinine, cystamine, and glucose. As seen in Figure 14, the ITO/SG-PANI/Urs electrode showed minimum response to the foreign compounds demonstrating the high selectivity in its action.
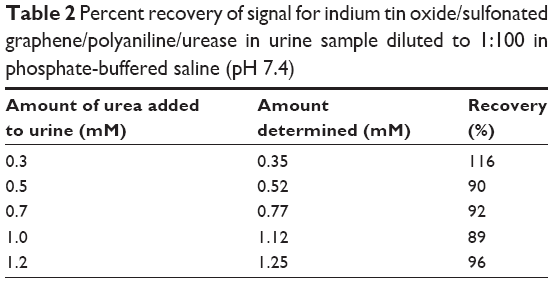 | Table 2 Percent recovery of signal for indium tin oxide/sulfonated graphene/polyaniline/urease in urine sample diluted to 1:100 in phosphate-buffered saline (pH 7.4) |
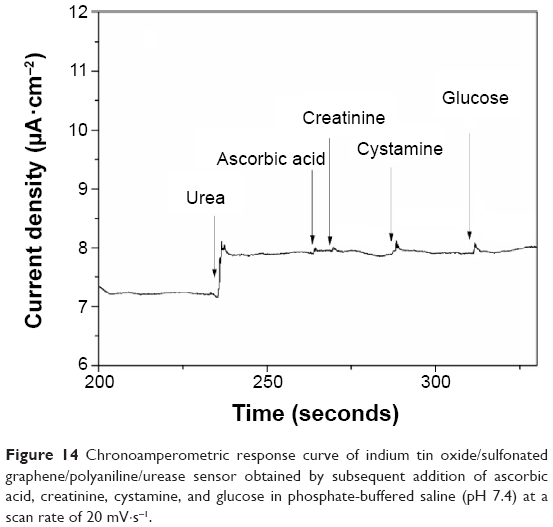 | Figure 14 Chronoamperometric response curve of indium tin oxide/sulfonated graphene/polyaniline/urease sensor obtained by subsequent addition of ascorbic acid, creatinine, cystamine, and glucose in phosphate-buffered saline (pH 7.4) at a scan rate of 20 mV·s−1. |
Conclusion
Electrochemical oxidative polymerization of aniline was successfully carried out in the presence of SGO to obtain SG-PANI nanocomposites. SG was found to be efficient in doping PANI, in such a way that the nanostructure was highly electroactive even in a neutral medium. Furthermore, it was demonstrated that SG-PANI can efficiently be used as a urea biosensor with comparatively good sensitivity (0.85 μA·cm−2·mM−1), with a fast response and better stability than that observed in other related studies employing polymer electrolytes. The retention of 81% of the initial activity of the immobilized Urs after 15 days highlights the suitability of the biosensor for real-time monitoring of urea. This cost-effective and simple method for designing urea biosensors thus appears more advantageous than other methods involving conventional electrodes.
Acknowledgment
This work was supported by the Gyeonggi Regional Research Center.
Disclosure
The authors report no conflicts of interest in this work.
References
Haque AM, Park H, Sung D, Jon S, Choi SY, Kim K. An electrochemically reduced graphene oxide-based electrochemical immunosensing platform for ultrasensitive antigen detection. Anal Chem. 2012;84:1871–1878. | ||
Francis PS, Lewis SW, Lim KF. Analytical methodology for the determination of urea: current practice and future trends. Trends Analyt Chem. 2002;21:389–400. | ||
Patton CJ, Crouch S. Spectrophotometric and kinetics investigation of the Berthelot reaction for the determination of ammonia. Anal Chem. 1977;49:464–469. | ||
Ramsing A, Růžička J, Hansen EH. A new approach to enzymatic assay based on flow-injection spectrophotometry with acid-base indicators. Anal Chim Acta. 1980;114:165–181. | ||
Freeman R, Li Y, Tel-Vered R, Sharon E, Elbaz J, Willner I. Self-assembly of supramolecular aptamer structures for optical or electrochemical sensing. Analyst. 2009;134:653–656. | ||
Grieshaber D, MacKenzie R, Vörös J, Reimhult E. Electrochemical biosensors – Sensor principles and architectures. Sensors. 2008;8:1400–1458. | ||
Betancourt T, Brannon-Peppas L. Micro- and nanofabrication methods in nanotechnological medical and pharmaceutical devices. Int J Nanomedicine. 2006;4:483–495. | ||
Senillou A, Jaffrezic-Renault N, Martelet C, Cosnier S. A miniaturized urea sensor based on the integration of both ammonium based urea enzyme field effect transistor and a reference field effect transistor in a single chip. Talanta. 1999;50:219–226. | ||
Sahney R, Anand S, Puri BK, Srivastava AK. A comparative study of immobilization techniques for urease on glass-pH-electrode and its application in urea detection in blood serum. Anal Chim Acta. 2006;578:156–161. | ||
Stenger-Smith JD. Intrinsically electrically conducting polymers. Synthesis, characterization, and their applications. Prog Polym Sci. 1998;23:57–79. | ||
Bhattacharya A, De A. Conducting composites of polypyrrole and polyaniline a review. Progress in Solid State Chemistry. 1996;24:141–181. | ||
Moliton A, Hiorns RC. Review of electronic and optical properties of semiconducting π-conjugated polymers: applications in optoelectronics. Polym Int. 2004;53:1397–1412. | ||
Zhang L, Jiang X, Niu L, Dong S. Syntheses of fully sulfonated polyaniline nano-networks and its application to the direct electrochemistry of cytochrome c. Biosens Bioelectron. 2006;21:1107–1115. | ||
Yue J, Epstein AJ. Electronic control of pH at sulfonated polyaniline electrodes. J Chem Soc Chem Commun. 1992:1540–1542. | ||
Salavagione H, Morales GM, Miras MC, Barbero C. Synthesis of a self-doped polyaniline by nucleophilic addition. Acta Polymerica. 1999;50:40–44. | ||
Luo YC, Do JS. Urea biosensor based on PANi(urease)-Nafion/Au composite electrode. Biosens Bioelectron. 2004;20:15–23. | ||
Coşkun E, Zaragoza-Contreras EA, Salavagione HJ. Synthesis of sulfonated graphene/polyaniline composites with improved electroactivity. Carbon. 2012;50:2235–2243. | ||
Ratinac KR, Yang W, Gooding JJ, Thordarson P, Braet F. Graphene and related materials in electrochemical sensing. Electroanalysis. 2011;23:803–826. | ||
Pumera M, Ambrosi A, Bonanni A, Chng ELK, Poh HL. Graphene for electrochemical sensing and biosensing. Trends Analyt Chem. 2010;29:954–965. | ||
Kuila T, Bose S, Mishra AK, Khanra P, Kim NH, Lee JH. Chemical functionalization of graphene and its applications. Prog Mater Sci. 2012;57:1061–1105. | ||
Shi J, Zhang H, Snyder A, et al. An aqueous media based approach for the preparation of a biosensor platform composed of graphene oxide and Pt-black. Biosens Bioelectron. 2012;38:314–320. | ||
Liu Y, Yu D, Zeng C, Miao Z, Dai L. Biocompatible graphene oxide-based glucose biosensors. Langmuir. 2010;26:6158–6160. | ||
Jung JH, Cheon DS, Liu F, Lee KB, Seo TS. A graphene oxide based immuno-biosensor for pathogen detection. Angew Chem Int Ed Engl. 2010;49:5708–5711. | ||
Shao Y, Wang J, Wu H, Liu J, Aksay IA, Lin Y. Graphene based electrochemical sensors and biosensors: a review. Electroanalysis. 2010;22:1027–1036. | ||
Chen JL, Yan XP, Meng K, Wang SF. Graphene oxide based photoinduced charge transfer label-free near-infrared fluorescent biosensor for dopamine. Anal Chem. 2011;83:8787–8793. | ||
Wang Y, Li Z, Wang J, Li J, Lin Y. Graphene and graphene oxide: biofunctionalization and applications in biotechnology. Trends Biotechnol. 2011;29:205–212. | ||
Devi R, Relhan S, Pundir CS. Construction of a chitosan/polyaniline/graphene oxide nanoparticles/polypyrrole/Au electrode for amperometric determination of urinary/plasma oxalate. Sens Actuators B Chem. 2013;186:17–26. | ||
Zhang Q, Li Y, Feng Y, Feng W. Electropolymerization of graphene oxide/polyaniline composite for high-performance supercapacitor. Electrochim Acta. 2013;90:95–100. | ||
Bai H, Xu Y, Zhao L, Li C, Shi G. Non-covalent functionalization of graphene sheets by sulfonated polyaniline. Chem Commun (Camb). 2009;(13):1667–1669. | ||
Hummers WS Jr, Offeman RE. Preparation of graphitic oxide. J Am Chem Soc. 1958;80:1339. | ||
Chen G, Zhai S, Zhai Y, et al. Preparation of sulfonic-functionalized graphene oxide as ion-exchange material and its application into electrochemiluminescence analysis. Biosens Bioelectron. 2011;26:3136–3141. | ||
Tao Y, Lin ZJ, Chen XM, et al. Functionalized multiwall carbon nanotubes combined with bis(2,2′-bipyridine)-5-amino-1,10-phenanthroline ruthenium(II) as an electrochemiluminescence sensor. Sens Actuators B Chem. 2008;129:758–763. | ||
Zhang K, Zhang LL, Zhao X, Wu J. Graphene/polyaniline nanofiber composites as supercapacitor electrodes. Chem Mater. 2010;22:1392–1401. | ||
Li G, Li Y, Peng H, Qin Y. Synthesis and electrochemical performances of dispersible polyaniline/sulfonated graphene composite nanosheets. Synth Met. 2013;184:10–15. | ||
Ma B, Zhou X, Bao H, Li X, Wang G. Hierarchical composites of sulfonated graphene-supported vertically aligned polyaniline nanorods for high-performance supercapacitors. J Power Sources. 2012;215:36–42. | ||
Guo Y, Zhou Y. Polyaniline nanofibers fabricated by electrochemical polymerization: A mechanistic study. Eur Polym J. 2007;43:2292–2297. | ||
Caussette M, Gaunand A, Planche H, Lindet B. Enzyme inactivation by inert gas bubbling. Progress in Biotechnology. 1998;15:393–398. | ||
Caussette M, Gaunand A, Planche H, Colombié S, Monsan P, Lindet B. Lysozyme inactivation by inert gas bubbling: kinetics in a bubble column reactor. Enzyme Microb Technol. 1999;24:412–418. | ||
Soukharev V, Mano N, Heller A. A four-electron O(2)-electroreduction biocatalyst superior to platinum and a biofuel cell operating at 0.88 V. J Am Chem Soc. 2004;126:8368–8369. | ||
Kudin KN, Ozbas B, Schniepp HC, Prud’Homme RK, Aksay IA, Car R. Raman spectra of graphite oxide and functionalized graphene sheets. Nano Lett. 2008;8:36–41. | ||
Yan X, Chen J, Yang J, Xue Q, Miele P. Fabrication of free-standing, electrochemically active, and biocompatible graphene oxide-polyaniline and graphene-polyaniline hybrid papers. ACS Appl Mater Interfaces. 2010;2:2521–2529. | ||
Liu Y, Deng R, Wang Z, Liu H. Carboxyl-functionalized graphene oxide–polyaniline composite as a promising supercapacitor material. J Mater Chem. 2012;22:13619–13624. | ||
Rana U, Malik S. Graphene oxide/polyaniline nanostructures: transformation of 2D sheet to 1D nanotube and in situ reduction. Chem Commun (Camb). 2012;48:10862–10864. | ||
Wang H, Hao Q, Yang X, Lu L, Wang X. Effect of graphene oxide on the properties of its composite with polyaniline. ACS Appl Mater Interfaces. 2010;2:821–828. | ||
Zhao G, Jiang L, He Y, et al. Sulfonated graphene for persistent aromatic pollutant management. Adv Mater. 2011;23:3959–3963. | ||
Tian S, Baba A, Liu J, et al. Electroactivity of polyaniline multilayer films in neutral solution and their electrocatalyzed oxidation of β-nicotinamide adenine dinucleotide. Adv Funct Mater. 2003;13:473–479. | ||
Liu J, Tian S, Knoll W. Properties of polyaniline/carbon nanotube multilayer films in neutral solution and their application for stable low-potential detection of reduced β-nicotinamide adenine dinucleotide. Langmuir. 2005;21:5596–5599. | ||
Ping Z, Nauer BGE, Neugebauer H, Theiner J, Neckel A. Protonation and electrochemical redox doping processes of polyaniline in aqueous solutions: Investigations using in situ FTIR-ATR spectroscopy and a new doping system. J Chem Soc Faraday T. 1997;93:121–129. | ||
Bartlett PN, Birkin PR, Wallace ENK. Oxidation of β-nicotinamide adenine dinucleotide (NADH) at poly(aniline)-coated electrodes. J Chem Soc Faraday T. 1997;93:1951–1960. | ||
Nugent JM, Santhanam KSV, Rubio A, Ajayan PM. Fast electron transfer kinetics on multiwalled carbon nanotube microbundle electrodes. Nano Lett. 2001;1:87–91. | ||
Bard AJ, Faulkner LR. Electrochemical methods: Fundamentals and applications. New York: Wiley; 1980. | ||
Zaidi NA, Foreman JP, Tzamalis G, Monkman SC, Monkman AP. Alkyl substituent effects on the conductivity of polyaniline. Adv Funct Mater. 2004;14:479–486. | ||
Eggenstein C, Borchardt M, Diekmann C, et al. A disposable biosensor for urea determination in blood based on an ammonium-sensitive transducer. Biosens Bioelectron. 1999;14:33–41. | ||
Rajesh, Bisht V, Takashima W, Kaneto K. An amperometric urea biosensor based on covalent immobilization of urease onto an electrochemically prepared copolymer poly (N-3-aminopropyl pyrrole-co-pyrrole) film. Biomaterials. 2005;26:3683–3690. | ||
Ali A, Ansari AA, Kaushik A, et al. Nanostructured zinc oxide film for urea sensor. Mater Lett. 2009;63:2473–2475. | ||
Maaref A, Barhoumi H, Rammah M, et al. Comparative study between organic and inorganic entrapment matrices for urease biosensor development. Sens Actuators B Chem. 2007;123:671–679. | ||
Crespilho FN, Iost RM, Travain SA, Oliveira ON Jr, Zucolotto V. Enzyme immobilization on Ag nanoparticles/polyaniline nanocomposites. Biosens Bioelectron. 2009;24:3073–3077. | ||
Adeloju SB, Shaw SJ, Wallace GG. Pulsed-amperometric detection of urea in blood samples on a conducting polypyrrole-urease biosensor. Anal Chim Acta. 1997;341:155–160. | ||
Dhand C, Das M, Datta M, Malhotra BD. Recent advances in polyaniline based biosensors. Biosens Bioelectron. 2011;26:2811–2821. | ||
Osaka T, Komaba S, Seyama M, Tanabe K. High-sensitivity urea sensor based on the composite film of electroinactive polypyrrole with polyion complex. Sens Actuators B Chem. 1996;36:463–469. |
 © 2015 The Author(s). This work is published and licensed by Dove Medical Press Limited. The full terms of this license are available at https://www.dovepress.com/terms.php and incorporate the Creative Commons Attribution - Non Commercial (unported, v3.0) License.
By accessing the work you hereby accept the Terms. Non-commercial uses of the work are permitted without any further permission from Dove Medical Press Limited, provided the work is properly attributed. For permission for commercial use of this work, please see paragraphs 4.2 and 5 of our Terms.
© 2015 The Author(s). This work is published and licensed by Dove Medical Press Limited. The full terms of this license are available at https://www.dovepress.com/terms.php and incorporate the Creative Commons Attribution - Non Commercial (unported, v3.0) License.
By accessing the work you hereby accept the Terms. Non-commercial uses of the work are permitted without any further permission from Dove Medical Press Limited, provided the work is properly attributed. For permission for commercial use of this work, please see paragraphs 4.2 and 5 of our Terms.