")
Back to Journals » Neuropsychiatric Disease and Treatment » Volume 11
Altered blood oxygen level-dependent signal variability in chronic post-traumatic stress disorder during symptom provocation
Authors Ke J , Zhang L, Qi R, Xu Q, Li W, Hou C, Zhong Y, Zhang Z, He Z, Lingjiang L, Lu G
Received 25 April 2015
Accepted for publication 10 June 2015
Published 23 July 2015 Volume 2015:11 Pages 1805—1815
DOI https://doi.org/10.2147/NDT.S87332
Checked for plagiarism Yes
Review by Single anonymous peer review
Peer reviewer comments 5
Editor who approved publication: Professor Wai Kwong Tang
Jun Ke,1,* Li Zhang,2,* Rongfeng Qi,1,* Qiang Xu,1 Weihui Li,2 Cailan Hou,3 Yuan Zhong,1 Zhiqiang Zhang,1 Zhong He,4 Lingjiang Li,2,5 Guangming Lu1
1Department of Medical Imaging, Jinling Hospital, Medical School of Nanjing University, Nanjing, 2Mental Health Institute, the Second Xiangya Hospital, National Technology Institute of Psychiatry, Key Laboratory of Psychiatry and Mental Health of Hunan Province, Central South University, Changsha, 3Guangdong Academy of Medical Science, Guangdong General Hospital, Guangdong Mental Health Center, Guangzhou, 4Department of Radiology of the Second Xiangya Hospital, Central South University, Changsha, 5Shenzhen Kangning Hospital of Guangdong Province, Shenzhen, People’s Republic of China
*These authors contributed equally to this work
Background: Recent research suggests that variability in brain signal provides important information about brain function in health and disease. However, it is unknown whether blood oxygen level-dependent (BOLD) signal variability is altered in post-traumatic stress disorder (PTSD). We aimed to identify the BOLD signal variability changes of PTSD patients during symptom provocation and compare the brain patterns of BOLD signal variability with those of brain activation.
Methods: Twelve PTSD patients and 14 age-matched controls, who all experienced a mining accident, underwent clinical assessment as well as fMRI scanning while viewing trauma-related and neutral pictures. BOLD signal variability and brain activation were respectively examined with standard deviation (SD) and general linear model analysis, and compared between the PTSD and control groups. Multiple regression analyses were conducted to explore the association between PTSD symptom severity and these two brain measures across all subjects as well as in the PTSD group.
Results: PTSD patients showed increased activation in the middle occipital gyrus compared with controls, and an inverse correlation was found between PTSD symptom severity and brain activation in the hippocampus and anterior cingulate cortex/medial prefrontal cortex. Brain variability analysis revealed increased SD in the insula, anterior cingulate cortex/medial prefrontal cortex, and vermis, and decreased SD in the parahippocapal gyrus, dorsolateral prefrontal cortex, somatosensory cortex, and striatum. Importantly, SD alterations in several regions were found in both traumatic and neutral conditions and were stratified by PTSD symptom severity.
Conclusion: BOLD signal variability may be a reliable and sensitive biomarker of PTSD, and combining brain activation and brain variability analysis may provide complementary insight into the neural basis of this disorder.
Keywords: brain variability, general linear model, insula, functional magnetic resonance imaging
Introduction
Post-traumatic stress disorder (PTSD) is one of the most common psychiatric disorders, affecting approximately 6.8% of the population globally.1 It occurs following terrifying or life-threatening events such as military combat, traffic accidents, or natural disasters. Individuals suffering from PTSD experience a constellation of symptoms including re-experiencing, avoidance, negative cognitions and mood, and arousal.2 Given the high prevalence of PTSD and its substantial negative effect on behavior, mood, and cognition of the sufferers, it is essential to get a better understanding of the neurobiological basis of this disorder.
In the past decade, advances in functional neuroimaging, especially functional magnetic resonance imaging (fMRI), have allowed researchers to identify the brain regions involved in the pathophysiology of PTSD. Most of these studies examined task-related brain activity by using different experiment paradigms, including symptom provocation, emotional processing, and cognitive activation.3 Based on these findings and animal research, the most accepted neurocircuitry model of PTSD posits that this disorder can be understood in terms of circuits involved in fear conditioning.4 Briefly, this model suggests amygdala hyperresponsivity to threat-related stimuli, with inadequate top–down governance over the amygdala by the anterior cingulate cortex/medial prefrontal cortex (ACC/mPFC) and hippocampus.4 In addition, many other brain regions have also been implicated in PTSD, including the insula, lateral prefrontal cortex, and visual cortex.5
However, findings across studies are often inconsistent, perhaps due to different imaging modalities, varied experiment paradigms, heterogeneous subject samples, and small sample sizes.6 It is also worth noting that most fMRI studies utilized general linear model (GLM) analysis, which in effect focused on average brain activation and took temporal variance of blood oxygen level-dependent (BOLD) signal as noise.7 One problem of this model-driven method is that hemodynamic response may vary from region to region and even from trial to trial.8 Furthermore, recent research has indicated that BOLD signal variability is more than just noise, and examining it can greatly improve our understanding of aging and diseases involving cognitive impairment.9
However, to date, no fMRI studies have investigated BOLD signal variability changes in emotion-related disorders, such as PTSD.
In this fMRI study, we first aimed to determine whether BOLD signal variability was altered in chronic PTSD patients during symptom provocation. Second, multiple regression analysis was performed to explore the relationship between BOLD signal variability and PTSD symptom severity. Lastly, the results were compared with those obtained with GLM analysis to identify the similarities and differences. We hypothesized that PTSD patients may show BOLD signal variability changes in regions previously suggested to be involved in PTSD, such as the hippocampus and ACC/mPFC. Given that signal variability analysis and GLM analysis focused on different characteristics of BOLD signal, there might be some differences in the activation- and variability-based brain patterns.
Methods
Participants and clinical assessment
This study was approved by the ethical committees of the Second Xiangya Hospital and the Central South of University, and written informed consent was obtained from all participants. Seventeen right-handed male PTSD patients and 14 right-handed male age-matched subjects without PTSD were recruited. All subjects were exposed to a devastating coal mining accident in 2005, and 2 years had elapsed when they took part in the current study. PTSD patients met DSM-IV (Diagnostic and Statistical Manual of Mental Disorders – IV Edition) criteria for current PTSD as confirmed by the Clinician Administered PTSD Scale (CAPS).10 Comorbid disorders were examined via the Structured Clinical Interview for DSM-IV.11
The exclusion criteria included a history of head injury or loss of consciousness, significant medical and neurological conditions, other lifetime or current psychiatric disorders, alcohol or drug abuse or dependence, or the use of psychiatric medication. Subjects with MRI contraindications or excessive head movement during MRI scanning were also excluded. Of the original participants, five PTSD patients were excluded due to comorbidity including depression and/or alcohol abuse, resulting in 12 PTSD patients and 14 control subjects included in the data analysis.
Symptom provocation
The symptom provocation procedure had been described previously.12 Stimuli consisted of 20 trauma-related pictures and 20 affectively neutral pictures, which were shown to all subjects the day before fMRI scanning. These two sets of pictures were balanced with regard to color, luminance, and complexity. The block design was +N-C-N-C+ (+, rest; N, neutral pictures; C, coal mining accident-related pictures). Subjects were instructed to pay attention to the pictures, but no behavior response was required. Each picture was presented for 6 seconds, and the total scanning lasted for 5 minutes.
fMRI data acquisition and preprocessing
MRI scans were performed on a GE Signa 1.5 T scanner (GE Healthcare, Milwaukee, WI, USA) with a standard quadrature head coil. The sections were placed approximately parallel to the anterior commissure–posterior commissure line. The BOLD signal was acquired with echo-planar imaging sequences using the following parameters: repetition time/echo time (TR/TE) =3,000/60 milliseconds, flip angle =90°, field of view =240×240 mm2, matrix =64×64, slices number =18, slice thickness =5 mm, intersection gap =1.5 mm, and total volume number =250. The fMRI data were preprocessed and analyzed using SPM8 (http://www.fil.ion.ucl.ac.uk/spm/). Briefly, the data were slice-time-corrected, realigned, normalized to standard Montreal Neurological Institute template, re-sampled into 3×3×3 mm3 voxels, and smoothed with an 8 mm Gaussian kernel.
GLM analysis
Brain regions involved in the symptom provocation task were identified using GLM analysis. In the first-level analysis for each participant, the evoked BOLD response was modeled with a boxcar function convolved with a canonical hemodynamic response function, with movement parameters from the realignment stage entered as covariates. Three first-level contrasts were created: 1) neutral vs baseline contrast, 2) traumatic vs baseline contrast, and 3) traumatic vs neutral contrast.
Contrast images were then entered into a random-effect two-sample t-test to determine the group difference, with age and education level included as covariates. Subsequently, multiple regression analysis was performed voxel-wise using SPM8 to investigate the association between brain response (using “con” images) and PTSD symptom severity (CAPS total scores) across all subjects and in the PTSD group. Unless otherwise specified, a combined height–extent threshold (voxel-wise P<0.01) was used to correct for multiple comparisons (corrected P<0.05). This threshold adjustment based on Monte Carlo simulations was applied utilizing AlphaSim within the REST toolbox (http://resting-fmri.sourceforge.net). For independent t-tests and multiple regression analyses, the corrected threshold was calculated within areas showing significant response in each contrast of interest within all subjects as a group.
BOLD signal variability analysis
Standard deviation (SD) was used as a measure of temporal variability of BOLD signal.13 First, the average time series from white matter and cerebrospinal fluid and the estimated six movement parameters were further regressed from the preprocessed voxel time series.14,15 After that, the time series were shifted by 2 TR (6 seconds) to account for the hemodynamic delay,16,17 and an additional block normalization procedure was performed. All blocks within each condition were normalized so that the overall four-dimensional mean across brain and block was 100 to correct for possible low-frequency artifacts.14,15 For each voxel, the block mean was subtracted, and all blocks for each task condition (trauma-related and neutral pictures were presented in the traumatic condition and the neutral condition, respectively) were concatenated.14,15 Then voxel SDs were calculated across the concatenated time series for both task conditions using an in-house software. For standard purpose, the SD maps were normalized by the following formula: normalized SD = (SD − global mean SD)/standard deviation of voxel SDs.
A repeated-measure analysis of variance (ANOVA) was used to determine the group × task interaction. Unpaired t contrasts were conducted to identify the SD difference between groups. Furthermore, multiple regression analyses were performed to examine the correlation between PTSD symptom severity and SD in the traumatic, neutral, and traumatic vs neutral condition across all subjects as well as in the PTSD group. The results were corrected for multiple comparisons using AlphaSim, as described earlier.
Results
Demographic and clinical variables
The demographic and clinical characteristics of both the PTSD group and the control group are summarized in Table 1. The PTSD group and the control group were similar in terms of age (P=0.131) and education level (P=0.163). PTSD patients showed significantly higher CAPS total scores, re-experiencing, avoidance, and hyperarousal scores (P<0.005) compared with controls.
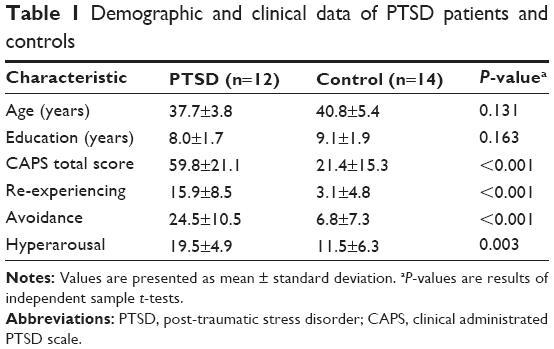 | Table 1 Demographic and clinical data of PTSD patients and controls |
Task-related brain response
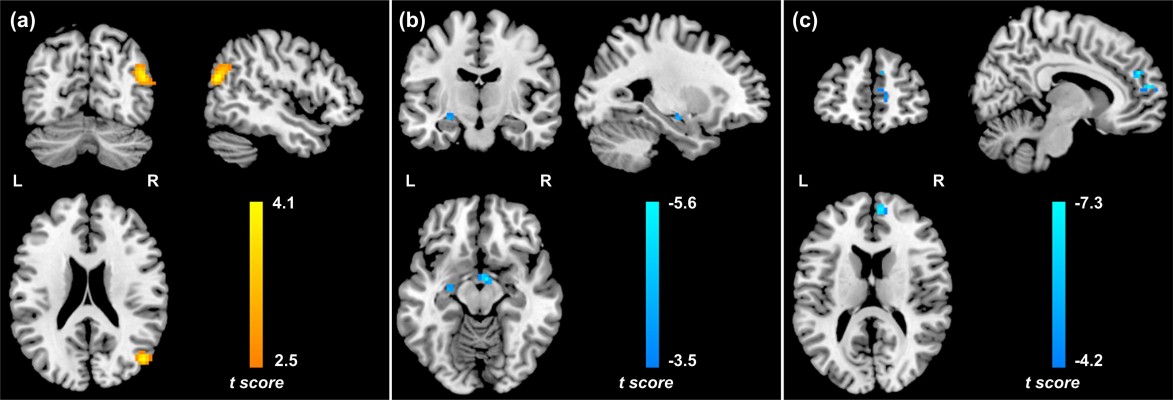
Compared with controls, PTSD patients showed significantly increased activation in the right middle occipital gyrus (MOG; 48, -72, 21; t=4.14; k=86 voxels) in the traumatic vs baseline condition (P<0.05, AlphaSim-corrected) (Figure 1A). There was no significant brain response difference between the two groups in the neutral vs baseline condition or in the traumatic vs neutral condition. Across all subjects, CAPS total scores negatively correlated with brain activation in the left hippocampus (-27, -12, -12; t=-4.06; k=8 voxels) in the traumatic vs baseline condition (Figure 1B), and the right ACC/mPFC (9, 48, 27; t=-7.26; k=25 voxels) in the traumatic vs neutral condition (P<0.001, uncorrected) (Figure 1C). In the PTSD group, CAPS total scores negatively correlated with brain activation in the left hippocampus (-24, -12, -9; t=-3.74; k=5 voxels) (P<0.01, uncorrected) and the left dorsolateral prefrontal cortex (dlPFC) in the traumatic vs baseline condition (Figure S1A and B), the left dlPFC in the neutral vs baseline condition (Figure S1C), and the right ACC/mPFC in the traumatic vs neutral condition (P<0.05, AlphaSim-corrected) (Figure S1D).
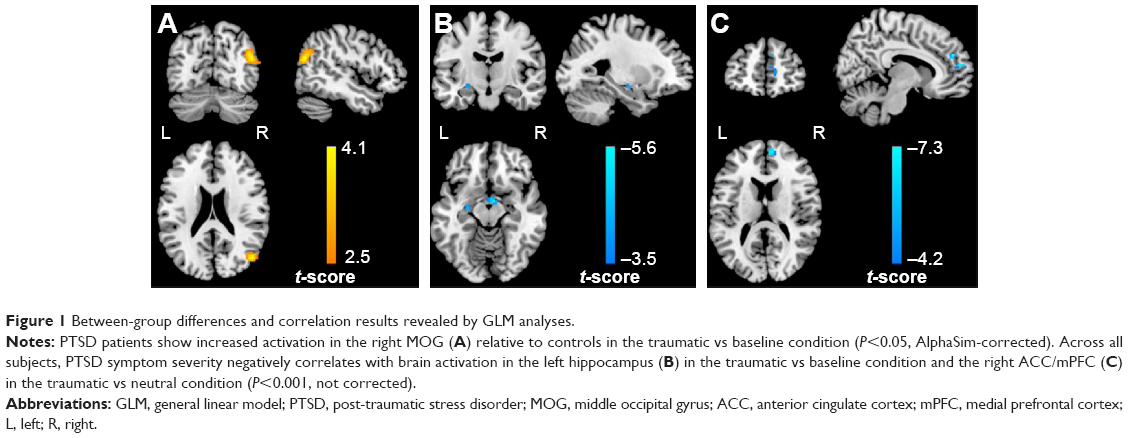 | Figure 1 Between-group differences and correlation results revealed by GLM analyses. |
BOLD signal variability
The ANOVA analysis of SD revealed no significant group × task interaction. In the neutral condition, PTSD patients showed increased SD in left insula and calcarine, and decreased SD in the left parahippocampal gyrus (PHG) and right dlPFC relative to controls. In the traumatic condition, PTSD patients showed increased SD in the left insula, vermis, and bilateral anterior cingulate cortices/ventral medial prefrontal cortices (ACCs/vmPFCs), and decrease SD in the left postcentral gyrus/precentral gyrus (PoCG/PreCG) compared with controls (Table 2, Figure 2).
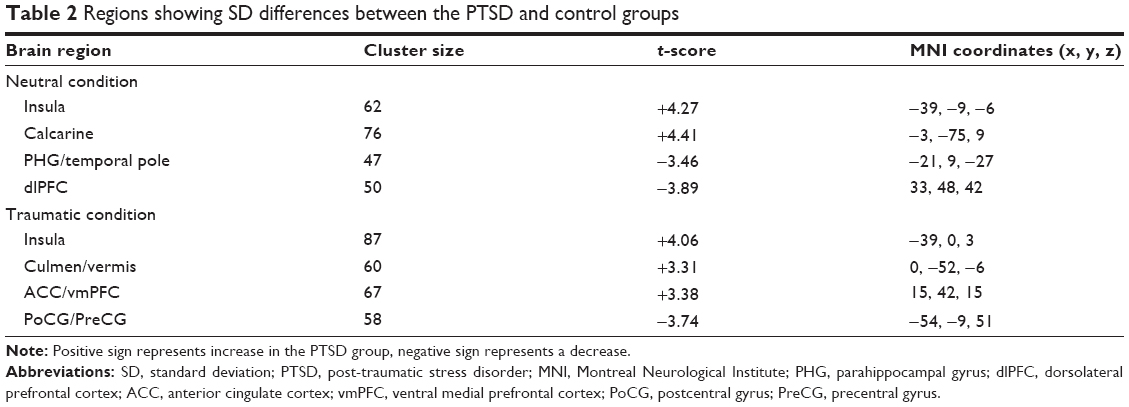 | Table 2 Regions showing SD differences between the PTSD and control groups |
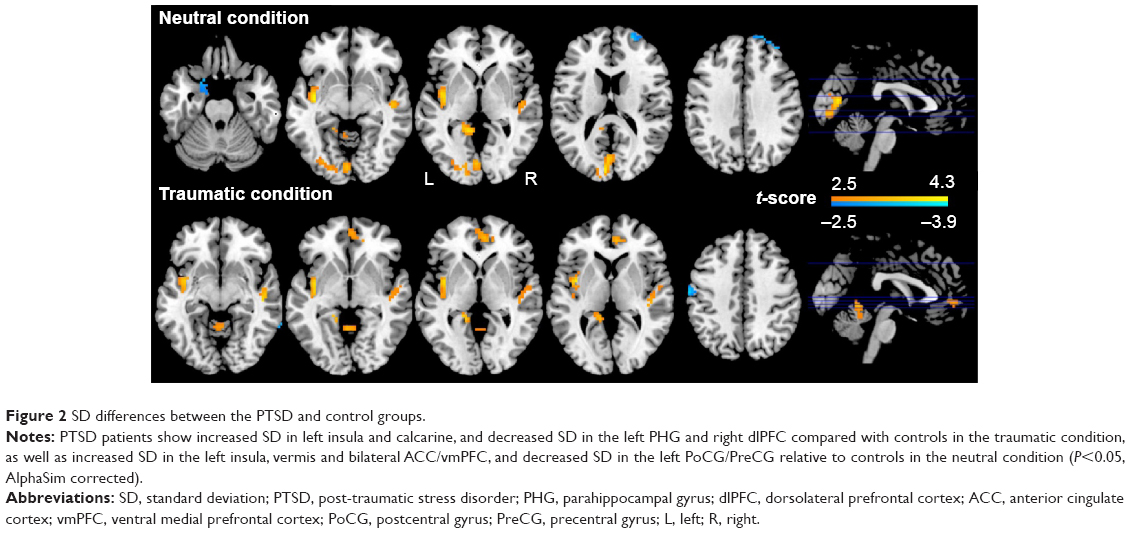 | Figure 2 SD differences between the PTSD and control groups. |
Multiple regression analysis revealed a positive correlation between CAPS total scores and SD in the left insula, vermis, and bilateral ACC/vmPFC, and a negative correlation between CAPS total scores and SD in the left PHG/putamen in the neutral condition across all subjects. In the PTSD group, CAPS total scores positively correlated with SD in the left ACC/vmPFC and negatively correlated with SD in the left PoCG/PreCG and right dlPFC in the neutral condition (Figure S2A). Furthermore, CAPS total scores positively correlated with SD in the left insula, vermis, bilateral ACC/vmPFC, dorsomedial prefrontal cortices, and posterior cingulate cortices/precuneus, and negatively correlated with SD in the left caudate and PoCG/PreCG in the traumatic condition (Table 3, Figure 3). In the PTSD group, a negative correlation was found between CAPS total scores and SD in the left PoCG/PreCG in the traumatic condition (Figure S2B).
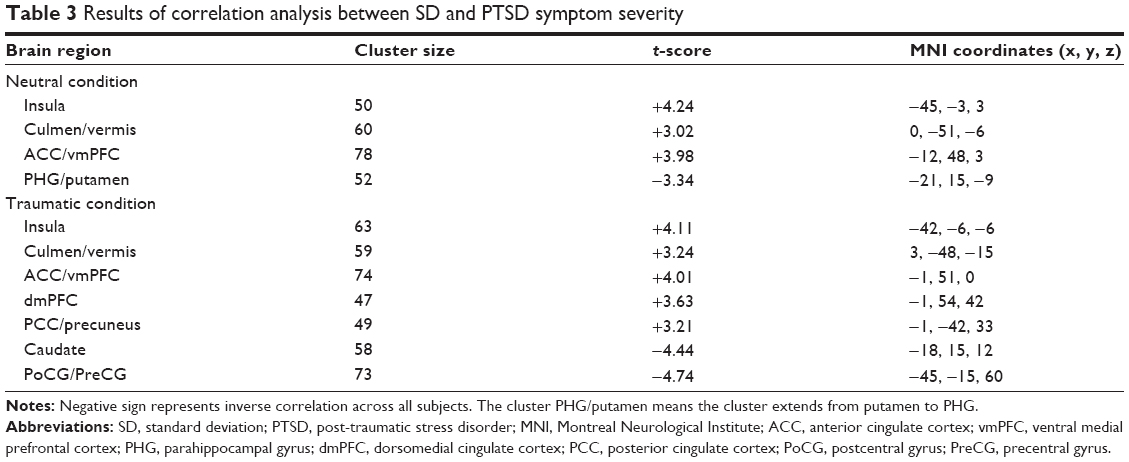 | Table 3 Results of correlation analysis between SD and PTSD symptom severity |
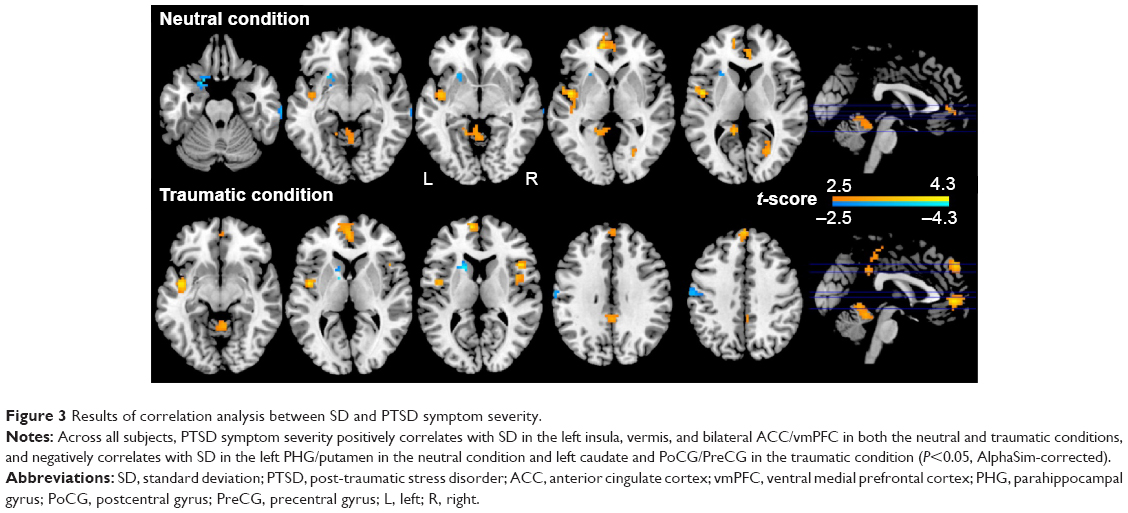 | Figure 3 Results of correlation analysis between SD and PTSD symptom severity. |
Post hoc check for susceptibility artifact signal loss
Given the relative long TE (60 milliseconds) used in the fMRI scan and the detection of group difference in brain activation or BOLD signal variability in the left PHG and right ACC/vmPFC, which are regions prone to fMRI signal loss,18 we conducted qualitative comparisons of the mean T2* signal in these regions. To do so, the mean T2* maps of one volume (the 15th) were created for the PTSD group and the control group, respectively, to show that there were adequate signals in these two regions (Figure 4A and B).
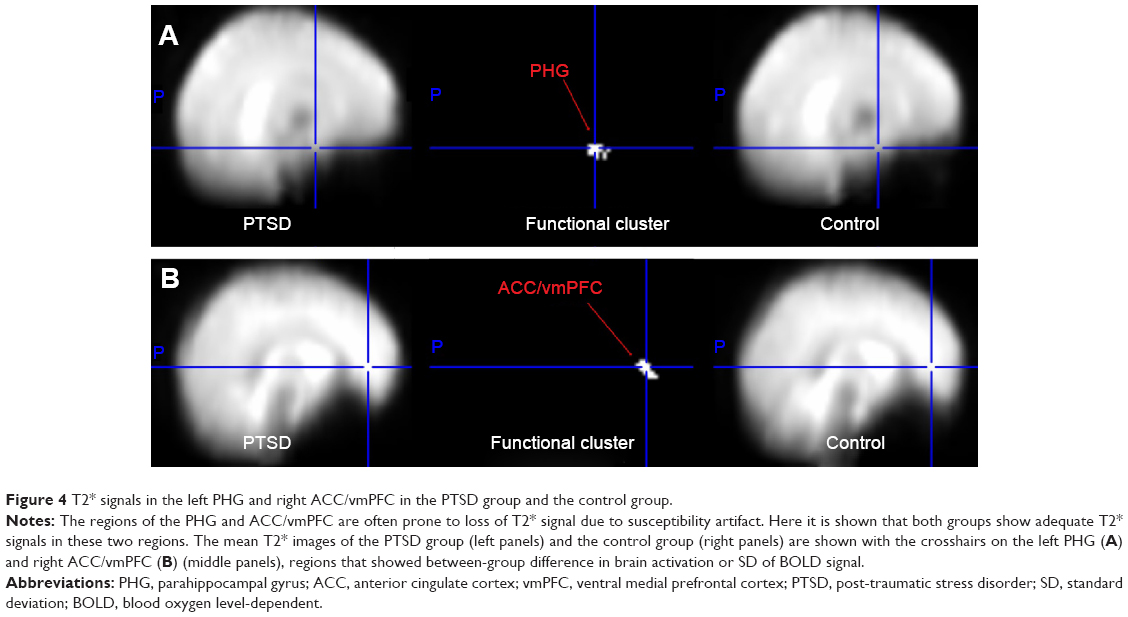 | Figure 4 T2* signals in the left PHG and right ACC/vmPFC in the PTSD group and the control group. |
Reliable measurement of BOLD signal variability
Although great efforts were made to accurately measure SD (see BOLD signal variability analysis), one potential remaining concern was whether the calculated SD of each task condition was “condition-pure”. For example, it was possible that a traumatic block may be impacted by the preceding neutral block (and vice versa).15 If this was true, the impact of a preceding block on variance within the first portion should be different from that on variance within later portions of the succeeding block. To test this, we calculated spit-half reliability on whole brain SD from concatenated first and second block halves for each task condition. Subsequently, spit-half reliability was examined for the PTSD group and control group separately.
The results showed that split-half reliability was good (r=0.9848 and 0.9844 for the neutral condition and the traumatic condition, respectively) (Figure 5A and B), with no clear difference in SD between the block halves. Both the PTSD group (r=0.9650 and 0.9678) (Figure 5C and D) and the control group (r=0.9778 and 0.9746) (Figure 5E and F) were similarly reliable for the two task conditions. Furthermore, when the analyses were performed only for voxels with significant group difference (voxels visible in Figures 2 and 3), good split-half reliability was also revealed for the full sample (r=0.9770 and 0.9773), PTSD group (r=0.9678 and 0.9710), and control group (r=0.9636 and 0.9580). Therefore, we found no evidence that SD values were markedly impacted by signal spillover.
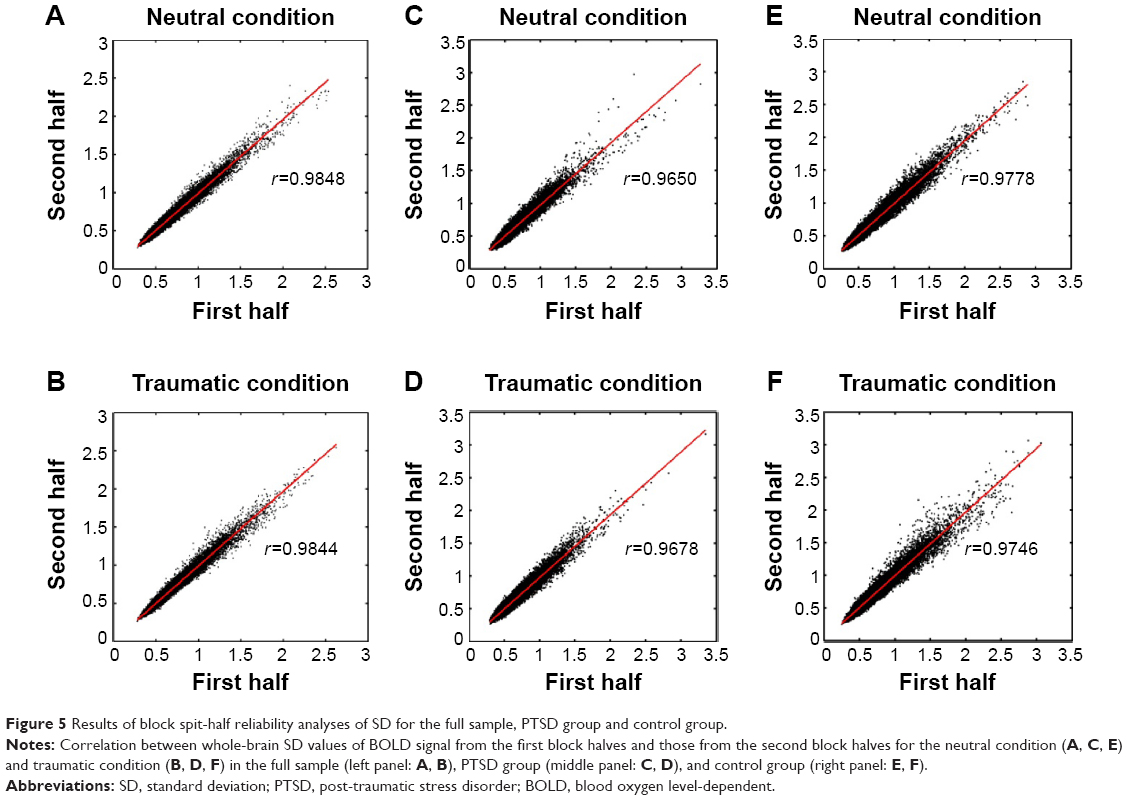 | Figure 5 Results of block spit-half reliability analyses of SD for the full sample, PTSD group and control group. |
Discussion
Using GLM and SD analysis, we investigated PTSD-related changes in brain activation and BOLD signal variability during symptom provocation. We found increased activation in the MOG in PTSD patients relative to controls, and an inverse correlation between PTSD symptom severity and brain activation in the hippocampus and ACC/mPFC. By contrast, SD analysis revealed widely distributed brain abnormality in PTSD, including both increased and decreased SD, which was further confirmed by the correlation results.
Functional correlates and measures of brain variability
Based on the assumption that central tendency reflects the most representative value in a distribution, previous fMRI research has mainly examined average brain activation using GLM analysis.14 Not until recently have researchers recognized that BOLD signal variability is functional and could offer novel views of brain function.9 Protzner speculated that BOLD variability is a metric that reflects what the system is capable of doing, whereas signal change in a specific contrast reflects what the system is doing.19 Others found that brain signal variability may reflect functional connectivity between regions, providing information about the level of functional integration.20,21 Moreover, stochastic resonance research suggests that there is an optimal level of “noise” that facilitates neural function,14,22 so it is possible that greater variability is required in some regions for optimal function, but not in others.14
The simplest measures of temporal brain signal variability include SD and mean square successive differences.23 Another commonly applied family of measures, such as multiscale entropy, examines signal complexity or temporal unpredictability.9 In the frequency domain, calculation of power provides an index of the amplitude of sinusoidal oscillations within and across frequencies, thus serving as a specific form of signal variability.9 Similarly, in resting-state fMRI studies, examining amplitude of low-frequency fluctuations (ALFF), which is equal to taking the square root of the power in a particular frequency range, can be a measure of BOLD signal variability.7
Brain activation changes
In this study, between-group difference in brain response during symptom provocation was found only in the right MOG, which showed greater activation in PTSD patients than in controls in the traumatic vs baseline condition. The MOG is a part of the visual association cortex and plays an important role in sensory processing of visuospatial information. It has also been implicated in flashback and emotional aspects of visual stimuli.24,25 Therefore, increased activation in the MOG may underline re-experiencing symptoms of PTSD patients. In line with our finding, the involvement of MOG in PTSD-specific processing of traumatic stimuli has been shown in multiple functional imaging studies.26
The multiple regression analysis showed a negative correlation between PTSD symptom severity and brain activation in the hippocampus and ACC/mPFC, indicating that PTSD patients with more severe symptoms had lower activation in these regions during symptom provocation. The hippocampus is important for encoding and recognition of declarative memories and environmental cues, while the ACC/mPFC is involved in extinction of fear memories.27 In accordance with our results, reduced volume and decreased activation in both regions have been frequently reported in previous research.3,28 Taken together, the current results support a traditional neurocircuitry model of PTSD implicating impaired brain function of the ACC/mPFC and hippocampus,4 and suggest declarative memory impairments, deficits in identifying safe contexts, and aberrant fear inhibition in PTSD.27
BOLD signal variability alterations
In this study, SD was used to measure BOLD signal variability. We found increased SD in the insula, ACC/vmPFC, vermis, and calcarine in PTSD, which was supported by the correlation analysis. The insula is involved in monitoring internal bodily states and is activated during processing of a variety of negative emotions.29 The mPFC is a key node of the neurocircuitry model of PTSD and commonly shows decreased activation during symptom provocation.3 The vermis plays a role in fear conditioning consolidation.30 Collectively, increased SD in these regions may be associated with heightened interoceptive awareness, proneness to anxiety, and abnormal fear response in PTSD patients.27 Partially consistent with our results, increased ALFF in the insula, ACC/mPFC, and vermis was revealed in several recent resting-state fMRI studies on PTSD.31,32
We also found decreased SD in the PHG, dlPFC, and PoCG/PreCG in PTSD patients, and a negative correlation between PTSD symptom severity and SD in the PHG, PoCG/PreCG, caudate, and putamen. The PHG is closely functionally related to the hippocampus, and is involved in episodic and contextual memory, as well as emotional response.33 It is also suggested that the posterior PHG is more involved in cognitive processing, while the anterior PHG is more involved in emotion regulation.34 The current results show an involvement of the anterior PHG, indicating impaired modulation of emotional processing, in particular, fear and anxiety in PTSD. The dlPFC plays a vital role in executive function, working memory, and attentional control processes. Thus, it is possible that abnormal function of the dlPFC may reflect PTSD patients’ difficulty challenging negative thoughts to cope with emotional stimuli.35 Supporting our results, both the PHG and dlPFC have been implicated in PTSD by structural as well as functional imaging studies,6,34,35 and decreased ALFF in the dlPFC in PTSD patients were reported in two recent resting-state fMRI studies.31,36
Our finding of decreased SD in the PoCG/PreCG was partially consistent with a recent meta-analysis on symptom provocation showing less activation in the left temporal cortex and bilateral PoCG.37 The authors interpreted the results as reflecting increased self-referential processing at the cost of the capacity to process concomitant environmental stimuli in PTSD patients. Both the PreCG and striatum (including caudate and putamen) modulate motor responses to stress, so decreased SD in these regions may be associated with tonic immobility in PTSD.38,39 Moreover, the striatum is also involved in reward anticipation and response.40 We speculate that impaired recruitment of this region may in part mediate loss of appreciation of pleasure, leading to anhedonia/emotional numbing in PTSD.41
Brain activation analysis vs brain variability analysis
The current results show that both the GLM and SD analyses support the involvement of the ACC/mPFC, hippocampus/PHG, and visual cortex in the pathophysiology of PTSD. However, the SD analysis also indicate altered brain function in many other related regions, including the insula, PoCG/PreCG, and striatum, suggesting SD may be a different but more sensitive biomarker of PTSD. Interestingly, we found similar SD changes in the traumatic and neutral conditions in multiple regions, which were also shown to have altered BOLD signal variability (measured by ALFF) during resting state.31,32,36 This finding accords with a previous report suggesting that BOLD signal variability appeared to relate to function of clinically relevant brain structures, regardless of task engagement.19
Study limitations
The strength of present study was absence of comorbidy in all participants, which could significantly reduce confounds when interpreting the results. However, the sample size was small, and this may partially explain the limited between-group differences in brain activation. It should also be noted that all participants were male survivors of a mining accident. Thus, findings may not generalize to a female population or PTSD arising from other types of trauma. Furthermore, the stimulus paradigm design may lead to refractoriness in the BOLD response, which may compromise the estimation of activation for task conditions, given that baseline condition was only acquired at the beginning and end of the scan. Finally, the brain variability results may be affected by high-frequency physiological artifacts. Nevertheless, stable SD differences between groups were revealed in both task conditions, which were further validated by the correlation analyses. Future studies with larger sample size and with different task designs are needed to confirm our findings and examine BOLD signal variability in relation to other structure or functional brain-related variables,42 such as functional connectivity, to better understand the physiological meaning of this measure.
Conclusion
In summary, SD analysis in the current study revealed brain function changes in multiple regions involved in PTSD, indicating that BOLD signal variability may provide new insight into the neural mechanism of PTSD. Furthermore, compared with GLM analysis, this method showed relatively constant and more widely distributed brain patterns during different task conditions. Taken together, BOLD signal variability may be a reliable and sensitive biomarker of PTSD, and combining GLM and SD analysis may produce complementary findings.
Acknowledgments
This work was supported by grants from the National Nature Science Foundation of China (grant number 30830046, 81171286, 91232714, 81301155, 81301209, 81201077), the National 973 Program of China (grant number +2013CB835100, 2009CB918303), the Program of the Chinese Ministry of Education (grant number 20090162110011), and the Chinese Key Grant (grant number BWS11J063, 10z026). We thank Douglas Garrett for his support in data analysis.
Author contributions
Lingjiang Li and Guangming Lu designed the research study. Li Zhang, Weihui Li, and Cailan Hou conducted the clinical assessment. Zhong He collected the imaging data. Rongfeng Qi, Qiang Xu, Yuan Zhong, and Zhiqiang Zhang conducted data processing and statistical analysis. Jun Ke, Li Zhang, and Rongfeng Qi wrote the first draft of the manuscript. All authors contributed toward data analysis, drafting and critically revising the paper, agreed to be accountable for all aspects of the work and approved the final paper.
Disclosure
The authors report no conflicts of interest in this work.
References
Kessler RC, Chiu WT, Demler O, Merikangas KR, Walters EE. Prevalence, severity, and comorbidity of 12-month DSM-IV disorders in the National Comorbidity Survey Replication. Arch Gen Psychiatry. 2005;62(6):617–627. | ||
American Psychiatric Association. Diagnostic and Statistical Manual of Mental Disorders. 5th ed. Washington, DC: American Psychiatric Press; 2013. | ||
Hughes KC, Shin LM. Functional neuroimaging studies of post-traumatic stress disorder. Expert Rev Neurother. 2011;11(2):275–285. | ||
Rauch SL, Shin LM, Phelps EA. Neurocircuitry models of posttraumatic stress disorder and extinction: human neuroimaging research – past, present, and future. Biol Psychiatry. 2006;60(4):376–382. | ||
Bremner JD. Neuroimaging in posttraumatic stress disorder and other stress-related disorders. Neuroimaging Clin N Am. 2007;17(4):523–538, ix. | ||
Patel R, Spreng RN, Shin LM, Girard TA. Neurocircuitry models of posttraumatic stress disorder and beyond: a meta-analysis of functional neuroimaging studies. Neurosci Biobehav Rev. 2012;36(9):2130–2142. | ||
Fox MD, Raichle ME. Spontaneous fluctuations in brain activity observed with functional magnetic resonance imaging. Nat Rev Neurosci. 2007;8(9):700–711. | ||
Zang Y, Jiang T, Lu Y, He Y, Tian L. Regional homogeneity approach to fMRI data analysis. Neuroimage. 2004;22(1):394–400. | ||
Garrett DD, Samanez-Larkin GR, MacDonald SW, Lindenberger U, McIntosh AR, Grady CL. Moment-to-moment brain signal variability: a next frontier in human brain mapping? Neurosci Biobehav Rev. 2013;37(4):610–624. | ||
Weathers FW, Keane TM, Davidson JR. Clinician-administered PTSD scale: a review of the first ten years of research. Depress Anxiety. 2001;13(3):132–156. | ||
First M, Spitzer R, Gibbons M, Williams J. Structured Clinical Interview for DSM-IV. New York: Biometrics Research Department, New York State Psychiatric Institute; 1995. | ||
Hou C, Liu J, Wang K, et al. Brain responses to symptom provocation and trauma-related short-term memory recall in coal mining accident survivors with acute severe PTSD. Brain Res. 2007;1144:165–174. | ||
Guitart-Masip M, Salami A, Garrett D, Rieckmann A, Lindenberger U, Bäckman L. BOLD variability is related to dopaminergic neurotransmission and cognitive aging. Cereb Cortex. 2015. bhv029. | ||
Garrett DD, Kovacevic N, McIntosh AR, Grady CL. Blood oxygen level-dependent signal variability is more than just noise. J Neurosci. 2010;30(14):4914–4921. | ||
Garrett DD, Kovacevic N, McIntosh AR, Grady CL. The modulation of BOLD variability between cognitive states varies by age and processing speed. Cereb Cortex. 2013;23(3):684–693. | ||
Fair DA, Schlaggar BL, Cohen AL, et al. A method for using blocked and event-related fMRI data to study “resting state” functional connectivity. Neuroimage. 2007;35(1):396–405. | ||
Hasson U, Nusbaum HC, Small SL. Task-dependent organization of brain regions active during rest. Proc Natl Acad Sci U S A. 2009;106(26):10841–10846. | ||
Ojemann JG, Akbudak E, Snyder AZ, McKinstry RC, Raichle ME, Conturo TE. Anatomic localization and quantitative analysis of gradient refocused echo-planar fMRI susceptibility artifacts. Neuroimage. 1997;6(3):156–167. | ||
Protzner AB, Kovacevic N, Cohn M, McAndrews MP. Characterizing functional integrity: intraindividual brain signal variability predicts memory performance in patients with medial temporal lobe epilepsy. J Neurosci. 2013;33(23):9855–9865. | ||
Misic B, Vakorin VA, Paus T, McIntosh AR. Functional embedding predicts the variability of neural activity. Front Syst Neurosci. 2011;5:90. | ||
Vakorin VA, Lippe S, McIntosh AR. Variability of brain signals processed locally transforms into higher connectivity with brain development. J Neurosci. 2011;31(17):6405–6413. | ||
McDonnell MD, Abbott D. What is stochastic resonance? Definitions, misconceptions, debates, and its relevance to biology. PLoS Comput Biol. 2009;5(5):e1000348. | ||
Mohr PN, Nagel IE. Variability in brain activity as an individual difference measure in neuroscience? J Neurosci. 2010;30(23):7755–7757. | ||
Whalley MG, Kroes MC, Huntley Z, Rugg MD, Davis SW, Brewin CR. An fMRI investigation of posttraumatic flashbacks. Brain Cogn. 2013;81(1):151–159. | ||
Tavanti M, Battaglini M, Borgogni F, et al. Evidence of diffuse damage in frontal and occipital cortex in the brain of patients with post-traumatic stress disorder. Neurol Sci. 2012;33(1):59–68. | ||
Barkay G, Freedman N, Lester H, et al. Brain activation and heart rate during script-driven traumatic imagery in PTSD: preliminary findings. Psychiatry Res. 2012;204(2):155–160. | ||
Pitman RK, Rasmusson AM, Koenen KC, et al. Biological studies of post-traumatic stress disorder. Nat Rev Neurosci. 2012;13(11):769–787. | ||
Acheson DT, Gresack JE, Risbrough VB. Hippocampal dysfunction effects on context memory: possible etiology for posttraumatic stress disorder. Neuropharmacology. 2012;62(2):674–685. | ||
Etkin A, Wager TD. Functional neuroimaging of anxiety: a meta-analysis of emotional processing in PTSD, social anxiety disorder, and specific phobia. Am J Psychiatry. 2007;164(10):1476–1488. | ||
Sacchetti B, Baldi E, Lorenzini CA, Bucherelli C. Cerebellar role in fear-conditioning consolidation. Proc Natl Acad Sci U S A. 2002;99(12):8406–8411. | ||
Yan X, Brown AD, Lazar M, et al. Spontaneous brain activity in combat related PTSD. Neurosci Lett. 2013;547:1–5. | ||
Bing X, Ming-Guo Q, Ye Z, et al. Alterations in the cortical thickness and the amplitude of low-frequency fluctuation in patients with post-traumatic stress disorder. Brain Res. 2013;1490:225–232. | ||
Sakamoto H, Fukuda R, Okuaki T, et al. Parahippocampal activation evoked by masked traumatic images in posttraumatic stress disorder: a functional MRI study. Neuroimage. 2005;26(3):813–821. | ||
Nardo D, Högberg G, Looi JCL, Larsson S, Hällström T, Pagani M. Gray matter density in limbic and paralimbic cortices is associated with trauma load and EMDR outcome in PTSD patients. J Psychiatr Res. 2010;44(7):477–485. | ||
Hayes JP, Hayes SM, Mikedis AM. Quantitative meta-analysis of neural activity in posttraumatic stress disorder. Biol Mood Anxiety Disord. 2012;2(9):1–13. | ||
Zhu H, Zhang J, Zhan W, et al. Altered spontaneous neuronal activity of visual cortex and medial anterior cingulate cortex in treatment-naïve posttraumatic stress disorder. Compr Psychiatry. 2014;55(7):1688–1695. | ||
Sartory G, Cwik J, Knuppertz H, et al. In search of the trauma memory: a meta-analysis of functional neuroimaging studies of symptom provocation in posttraumatic stress disorder (PTSD). PLoS One. 2013;8(3):e58150. | ||
Volchan E, Souza GG, Franklin CM, et al. Is there tonic immobility in humans? Biological evidence from victims of traumatic stress. Biol Psychiatry. 2011;88(1):13–19. | ||
Lindauer RJ, Booij J, Habraken JB, et al. Cerebral blood flow changes during script-driven imagery in police officers with posttraumatic stress disorder. Biol Psychiatry. 2004;56(11):853–861. | ||
Robinson BL, Shergill SS. Imaging in posttraumatic stress disorder. Curr Opin Psychiatry. 2011;24(1):29–33. | ||
Felmingham KL, Falconer EM, Williams L, et al. Reduced amygdala and ventral striatal activity to happy faces in PTSD is associated with emotional numbing. PLoS One. 2014;9(9):e103653. | ||
Grady CL, Garrett DD. Understanding variability in the BOLD signal and why it matters for aging. Brain Imaging Behav. 2014;8(2):274–283. |
Supplementary materials
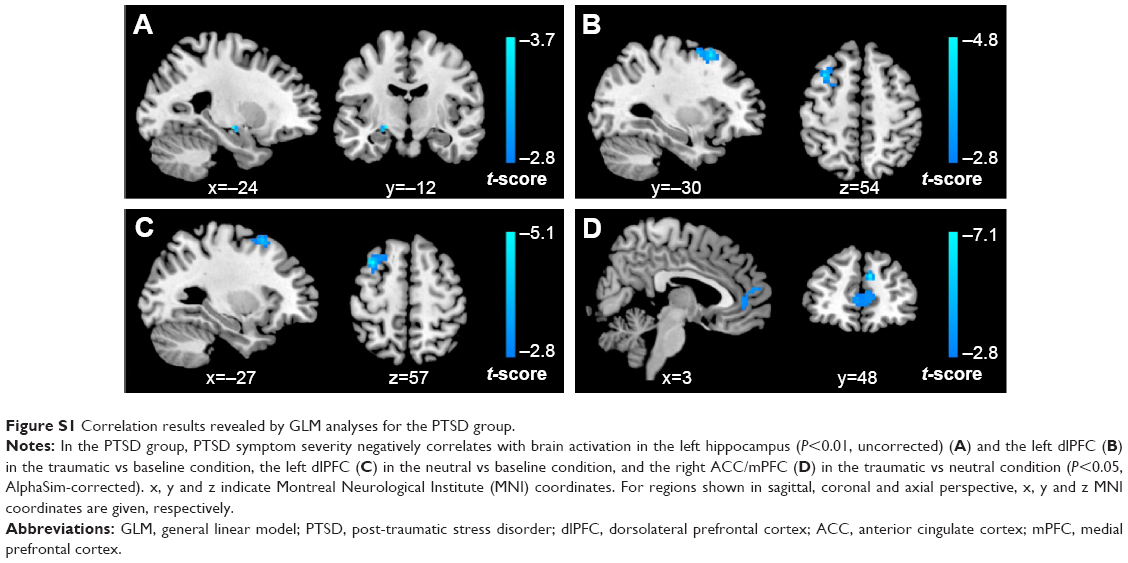 | Figure S1 Correlation results revealed by GLM analyses for the PTSD group. |
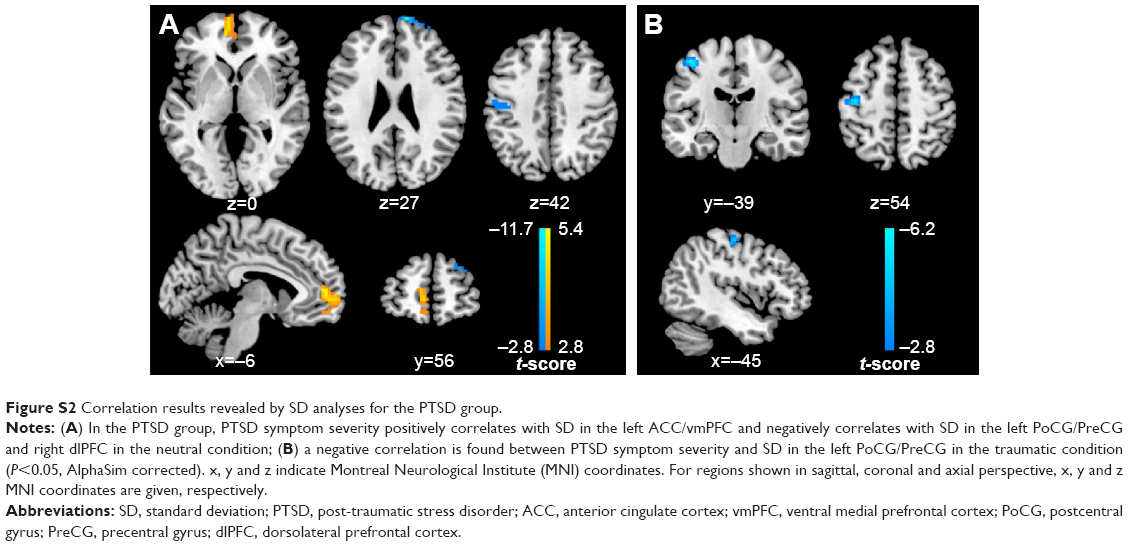 | Figure S2 Correlation results revealed by SD analyses for the PTSD group. |
 © 2015 The Author(s). This work is published and licensed by Dove Medical Press Limited. The full terms of this license are available at https://www.dovepress.com/terms.php and incorporate the Creative Commons Attribution - Non Commercial (unported, v3.0) License.
By accessing the work you hereby accept the Terms. Non-commercial uses of the work are permitted without any further permission from Dove Medical Press Limited, provided the work is properly attributed. For permission for commercial use of this work, please see paragraphs 4.2 and 5 of our Terms.
© 2015 The Author(s). This work is published and licensed by Dove Medical Press Limited. The full terms of this license are available at https://www.dovepress.com/terms.php and incorporate the Creative Commons Attribution - Non Commercial (unported, v3.0) License.
By accessing the work you hereby accept the Terms. Non-commercial uses of the work are permitted without any further permission from Dove Medical Press Limited, provided the work is properly attributed. For permission for commercial use of this work, please see paragraphs 4.2 and 5 of our Terms.