")
Back to Archived Journals » Energy and Emission Control Technologies » Volume 5
Advances and critical aspects in the life-cycle assessment of battery electric cars
Received 9 August 2016
Accepted for publication 30 October 2016
Published 1 February 2017 Volume 2017:5 Pages 1—18
DOI https://doi.org/10.2147/EECT.S60408
Checked for plagiarism Yes
Review by Single anonymous peer review
Peer reviewer comments 2
Editor who approved publication: Dr Hisham Khatib
Eckard Helmers,1 Martin Weiss2
1Department of Environmental Planning and Technology, Environment Campus Birkenfeld, University of Applied Sciences Trier, Birkenfeld, Germany; 2Sustainable Transport Unit, Directorate C – Energy, Transport and Climate, European Commission – DG Joint Research Centre, Ispra, Italy
Abstract: Concerns over climate change, air pollution, and oil supply have stimulated the market for battery electric vehicles (BEVs). The environmental impacts of BEVs are typically evaluated through a standardized life-cycle assessment (LCA) methodology. Here, the LCA literature was surveyed with the objective to sketch the major trends and challenges in the impact assessment of BEVs. It was found that BEVs tend to be more energy efficient and less polluting than conventional cars. BEVs decrease exposure to air pollution as their impacts largely result from vehicle production and electricity generation outside of urban areas. The carbon footprint of BEVs, being highly sensitive to the carbon intensity of the electricity mix, may decrease in the nearby future through a shift to renewable energies and technology improvements in general. A minority of LCAs covers impact categories other than carbon footprint, revealing a mixed picture. Up to date little attention is paid so far in LCA to the efficiency advantage of BEVs in urban traffic, the gap between on-road and certified energy consumption, the local exposure to air pollutants and noise and the aging of emissions control technologies in conventional cars. Improvements of BEV components, directed charging, second-life reuse of vehicle batteries, as well as vehicle-to-home and vehicle-to-grid applications will significantly reduce the environmental impacts of BEVs in the future.
Keywords: toxic emissions, China, energy use, carbon footprint, impact categories, environmental impact, health impact
Introduction – sustainability shortfalls of the transport sector as rationale for the deployment of battery electric vehicles (BEVs)
The large-scale deployment of BEVs is widely regarded as a suitable strategy to address major sustainability shortfalls of the transport sector, namely its contribution to urban air pollution and anthropogenic climate change and its dependence on nonrenewable fossil fuels. Air pollution caused by fine particulate matter (with a diameter of ≤2.5 μm; PM2.5) and ozone (O3), specifically in densely populated areas, caused 3.3 million premature deaths worldwide in 2010.1 Twenty-four percent of the worldwide CO2 emissions were attributed to the transport sector in 2006; 70% of these emissions stem from road transport alone.2 Moreover, transport accounted for 28% of the global final energy use in 20103 and for >50% of the global oil consumption.4 While the energy consumption of other sectors grew only marginally, global transport consumed ~20% more final energy in 2015 than in 2008.5,6 In the European Union (EU), road transport accounted for 82% of the total transport-related final energy use; passenger cars consume 60% of this share.7
In this situation, BEVs indeed present several advantages over conventional passenger cars equipped with an internal combustion engine vehicle (ICEV). BEVs do not exhibit tailpipe emissions; their electric engines are comparatively efficient, and the electricity required for propulsion can be generated from a diverse stock of resources, including renewables. However, since BEVs have been promoted for the past decade, there has also been criticism that they may shift emissions from vehicle use to vehicle production and electricity generation, thereby potentially increasing environmental and health impacts elsewhere.8 In fact, the electric vehicle is a paragon emphasizing the need of assessing a product’s impact over the life cycle instead of the operation phase only. Moreover, the large diversity in economically viable electricity generation renders the environmental performance of electric vehicles case specific and sensitive to the actual electricity mix.9,10 This situation has led to an intensified scientific debate about the environmental impacts of BEVs that can be comprehensively quantified by applying the internationally standardized life-cycle assessment (LCA) methodology.11,12
Here, we attempt to survey the recent literature on the environmental impacts of BEVs with the objective to sketch major trends and identify critical aspects that deserve further attention or treatment. Our research can help adding rationale to the discussion about support policies for BEVs and highlight challenges that need to be addressed to optimize the contribution of BEVs toward a more sustainable passenger road transport. The article continues with background information on the global market for passenger cars and on the LCA methodology, followed by methods and results. The article ends with discussion and conclusions.
Background information
The global passenger car market
At present, there are some 900 million light-duty vehicles in use worldwide;13 most of these are passenger cars. This number is expected to almost double until 2030.5,14 The global sales of passenger cars have been growing steadily in past decades, reaching 70 million in 2015 (Figure 1; for key automobile figures refer Cames and Helmers15). Mass-produced BEVs were introduced into the market around 2010. Their sales exhibited a stabilized growth in the past years, reaching 500,000 vehicles in 2015. Yet, at present, BEVs occupy only a small niche, with a share of 0.8% in the global passenger car market (Figure 1).
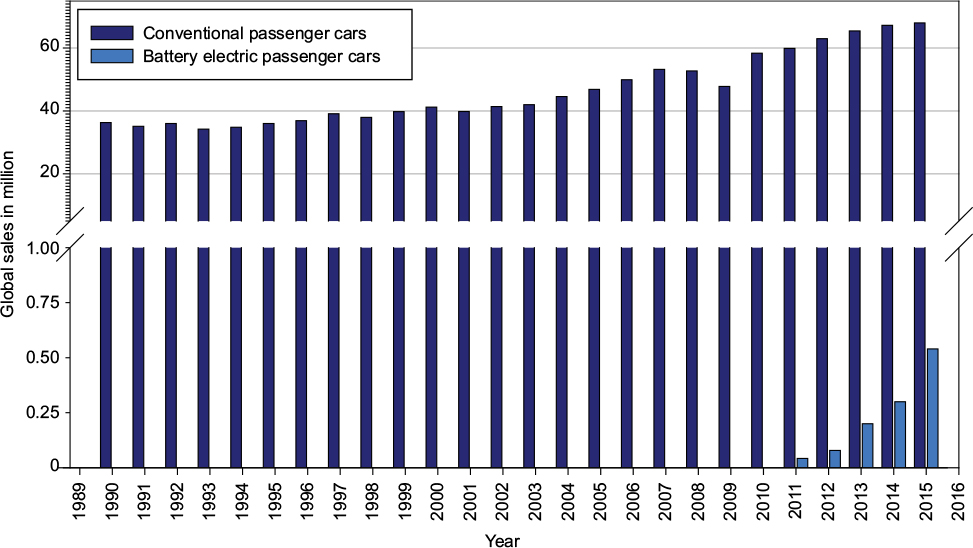 | Figure 1 Global passenger car sales. Note: Data from International Energy Agency16, Weiss et al134, GAS2135, OICA136. |
In 2014, the global BEV stock was 655,000, representing 0.08% of the global stock of passenger cars.16 BEV sales are concentrated in a few countries; only in the Netherlands, Norway, Sweden, and the USA have these vehicles acquired a market share of >1% in 2014.16 The largest BEV fleets are in use in the USA (245,104), Japan (108,248), China (83,198), the Netherlands (43,762), Norway (40,887), and France (30,912).16 All of these countries have implemented fiscal incentives to support the market penetration of BEVs.17 Policy makers have formulated ambitious goals for the BEV market aiming at running 20 million BEVs on the roads worldwide by 2020.18 Similarly, scientists model very optimistic deployment scenarios, as e.g. forecasting ~90% market share of BEVs in Japan by 2050.19,20
A short overview of the LCA methodology
The environmental and health impacts of BEVs can be quantified and compared with those of conventional passenger cars by applying an LCA methodology. LCA comprises a standardized framework for quantifying and evaluating the impacts of products and services11,12 and consists of the following four dedicated steps (Figure 2):
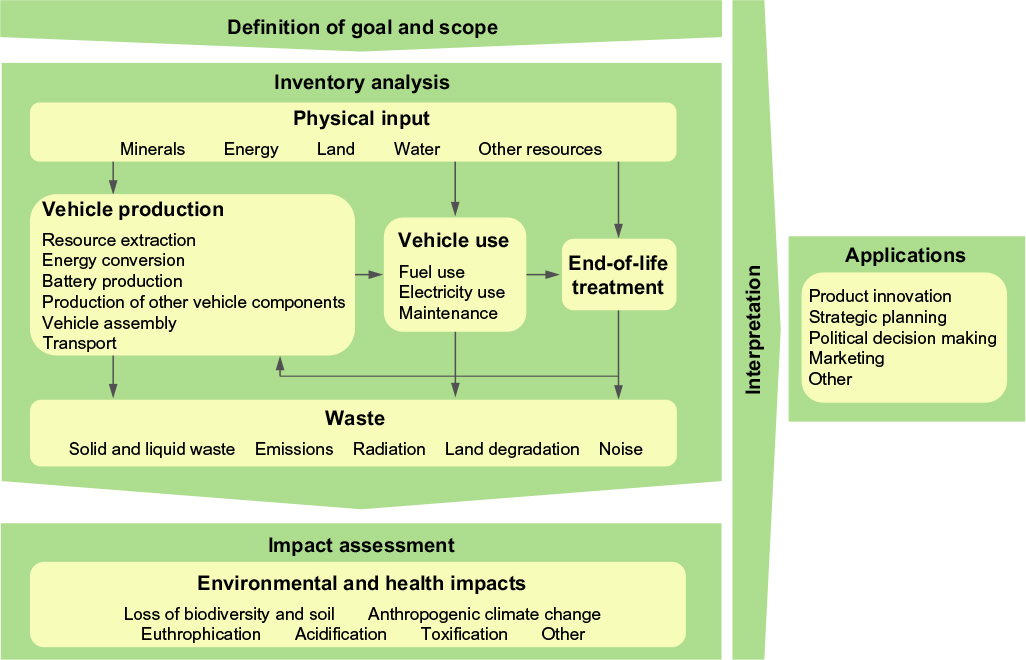 | Figure 2 Stylized life-cycle assessment of BEVs. Note: Data from ISO.11 Abbreviation: BEVs, battery electric vehicles. |
First, the definition of goal and scope clarifies the objective of the assessment, the product system and its boundaries, the functional unit, any choices regarding allocation procedures, covered impact categories, and the methodology of the impact assessment. In the life-cycle modeling of a vehicle, the “foreground system” (production, use phase, and end-of-life treatment) can be differentiated from a “background system” (materials, resources, electricity, infrastructure provision, and waste generation).21
Second, the life-cycle inventory analysis concerns the collection of data and the quantification of environmentally relevant inputs and outputs of the system under consideration.
Third, the life-cycle impact assessment (LCIA) evaluates the inputs and outputs with respect to their environmental and health impacts and aggregates impacts belonging to the same category into a single impact value by using so-called characterization factors. The LCA data published on BEVs differ with respect to the number of impact categories considered.
Fourth, the interpretation discusses the results in a broader context and draws conclusions. This step may also include a sensitivity analysis (potentially requiring the collection of additional inventory data) and the articulation of recommendations for producers, consumers, or policy makers.
When defining the goal and scope for the LCA of BEVs, several choices have to be made, which are particularly critical to the result. An LCA ideally considers the entire product life cycle. Adopting this comprehensive approach is referred to as a “cradle-to-grave” or, depending on the end-of-life modeling choice, “cradle-to-cradle” analysis. Specific aspects of a vehicle’s life cycle can be assessed , e.g., for regulatory purposes, through
“tank-to-wheel” (TTW) analysis focusing on the end-use energy conversion in the vehicles engine and
“well-to-wheel” (WTW) analysis focusing on the entire supply chain of fuels and electricity including end-use conversion.
TTW and WTW analyses are widely applied to assess the energy use and greenhouse gas (GHG) emissions of BEVs compared to conventional vehicles (driven by conventional and alternative fuels) as well as to other competing modes of transport.22 The WTW methodology can be seen as a simplified LCA that focuses on the fuel but ignores the production and end-of-life treatment of the vehicle.23 To account for the energy-intensive production of batteries, Moro and Helmers22 proposed a hybrid method that extends the conventional WTW analysis by incorporating the energy use and GHG emissions of battery production.
Methods
This article seeks to identify critical aspects in the LCA of BEVs, ie, light-duty vehicles solely propelled by an electric engine that draws energy from an externally rechargeable battery.24 Fuel cell cars are not considered in this article. Although highly relevant in the overall socioeconomic context, the following was excluded from our analysis: 1) considerations on the price and cost competitiveness of BEVs and 2) impacts on road safety that the large-scale deployment of electric cars will arguably incur. By limiting our focus to the environmental and health impacts of BEVs, we attempt to comment major developments in the past years, sketch out areas where advances have been made, and highlight knowledge gaps that demand further attention. To this end, we conduct a scoping review of the following LCA studies published mainly in the English literature before March 2016: 1) peer-reviewed articles available through “Scopus” and “ResearchGate” and 2) scientific reports, presentations, workshop documents, theses, and working papers identified via the search engine “Google scholar”. The online search was conducted by using the following keywords: “electric cars”, “electric vehicles”, “battery electric cars”, and “battery electric vehicles” in combination with the terms “environmental impacts”, “life-cycle assessment”, and “LCA”.
The identified studies differ from each other with respect to methodological choices, the amount of impact categories considered, and the degree of detail in which inventory data are collected and documented. The results of individual LCAs are therefore often not directly comparable to each other and may strictly be valid only for the chosen set of boundary conditions. In this article, we do not aim to provide a comprehensive overview of value ranges in the various impact categories. We also do not attempt to correct studies for methodological differences in the inventory analysis and impact assessment. Instead, we discuss values and value ranges as given in relevant studies in conjunction with the underlying assumptions.
Results
Key statistics
LCAs of BEVs as well as WTW energy and GHG emission analyses are discussed in several hundred articles and reports, exhibiting an evolution of scientific LCA-related questions and methods. We find that between 2011 and 2015, 126 articles and scientific reports assess the environmental impacts of BEVs (Figure 3).
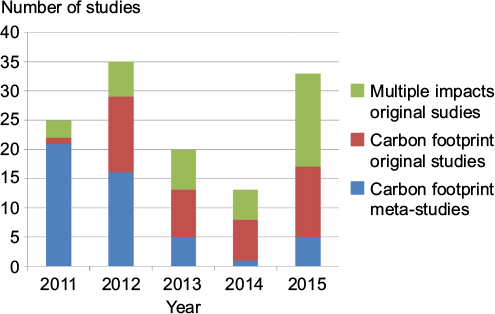 | Figure 3 Number of articles and scientific reports published between 2011 and 2015 on the environmental impacts of BEVs. Abbreviation: BEVs, battery electric vehicles. |
Of the 126 publications, 48 publications represent meta-studies without individual inventory data, summarizing and evaluating the results of primary LCAs (Figure 3). Seventy-eight publications constitute LCAs based on original inventory data. Thirty-seven of these, mainly published in 2015, quantify next to the carbon footprint also other environmental impacts (Figure 3). However, only eight of the 37 studies modeled impact categories in-line with the current understanding of a comprehensive LCA according to ReCiPe (see below under the “Toxic emissions and further environmental impacts” section).25 The remaining 29 studies followed different approaches in assessing the environmental and health impacts of BEVs. The LCAs conducted by Notter et al26 and Habermacher21 are among the first to quantify the environmental impacts of BEVs in a comprehensive manner. We identify a clear trend toward a standardization of life-cycle inventory data, driven by advances in the ecoinvent database, to allow easier modeling and better data comparison.27,28 LCA studies unanimously point out that relative to conventional vehicles, BEVs tend to shift energy use and environmental impacts from the actual vehicle use to production (largely related to battery production and energy provision). Most of the studies attempt to quantify absolute environmental impacts, while aspects of human exposure to pollutants receive comparatively little attention. In recent years, the growing knowledge on the environmental impacts of BEVs allowed scenario building and future projection of vehicle-specific and fleet-wide environmental impacts under certain regional conditions, thereby accounting also for parameters such as driver behavior, modal shift, traffic intensity, and the development of a charging infrastructure.29–37 Complex market diffusion scenarios for BEVs have been modeled considering the interactions of environmental, social, and economic aspects.38
Energy use of BEVs
The energy use and efficiency of BEVs have received particular interest in science and policy making, reflected by an abundance of WTW23 studies. Energy also plays an important role as a function to describe resource consumption in LCA models.39 The energy use of BEVs (in absolute terms or relative to conventional vehicles) depends on whether TTW, WTW, or the entire life cycle is considered. In terms of TTW energy use, the electricity consumption of BEVs varies broadly depending on engine capacity, the assumed driving style, and ambient conditions. Literature data range around ~15 kWh/100 km,40 10–20 kWh/100 km,41 and 17–27 kWh/100 km.42 An electricity consumption of 10–20 kWh/100 km is equivalent to only 1–2 L of fossil fuel/100 km,41 which indicates a factor of 3–4 TTW efficiency advantage of BEVs over conventional passenger cars.43 Moreover, electric vehicles drive most efficiently under urban conditions characterized by transient driving at low-to-medium speeds, whereas conventional vehicles with combustion engines exhibit the lowest efficiency in urban driving.
We identify several challenges that could be addressed to quantify the energy use of BEVs more accurately. The use-phase energy consumption of mini-class BEVs and conventional vehicles that are predominantly driven in urban environments can be more reliably quantified by using actual urban electricity and fuel consumption data instead of averages obtained from type approval in the laboratory.44 The comparison of the TTW energy use of BEVs and conventional cars is potentially hampered by differences in vehicle mass and aerodynamic drag. This problem has been addressed by Helmers and Marx45 who electrified a conventional passenger car. They found that the energy consumption under identical driving conditions can be decreased from 45.1 kWh/100 km to 10.8 kWh/100 km if the vehicles run with an electric engine instead of the previously installed combustion engine, suggesting a weight-normalized improvement in the TTW energy efficiency by a factor of 4.45 The authors note that the battery adds some 160 kg (in case of a mini-class car)45 up to 600 kg (in case of a Tesla Model S)42 to the mass of the vehicle, which in turn absorbs a part of BEV’s superior TTW efficiency.
While the TTW energy consumption of BEVs differs within relatively large ranges, a comparison of the TTW energy use for individual vehicle classes reveals a stable 3.3–3.6-fold efficiency advantage of BEVs compared to conventional passenger cars.43 Even fuel cell electric vehicles (FCVs) cannot deliver such a TTW efficiency as they are between 1.643 and 2.6 times more energy efficient than conventional passenger cars. The efficiency benefits of BEVs may decrease, however, when the WTW chain of resource extraction, energy conversion, and energy transport is included in the assessment. While losses from the extraction of energy resources, electricity transmission, and vehicle recharging are typically small but not negligible, conversion losses in the power sector may amount to 60%±10% if electricity is produced from fossil fuels. Accordingly, the WTW energy use of BEVs can vary over a wide range depending on the local electricity mix.
The application of BEVs is most desirable in case of an efficient electricity supply chain and an electricity mix with a high share of renewables. BEVs can drive with 11% WTW energy efficiency in case electricity is produced by outdated coal-fired power plants connected to an inefficient grid and charging infrastructure.45 However, in case electricity is largely produced from renewables fed into a modern grid and charging infrastructure, WTW energy efficiency can reach up to 77%.45 The life-cycle energy use of BEVs can vary within a wide range, depending, in addition, on the energy use during vehicle production, most importantly, the production of the battery, and the actual vehicle use, ie, the yearly mileage and the vehicle lifetime.
Carbon footprint
General modeling considerations
The carbon footprint comprises the total amount of emitted GHGs46 and is by far the most examined impact of BEVs. In fact, the majority of LCAs on BEVs focuses solely on the carbon footprint (Figure 3). This choice could be justified by 1) the broad social awareness of global climate change and 2) the observation that most of the other environmental and health impacts (eg, acidification, fine dust emissions, and tropospheric ozone formation) originate from fossil fuel combustion and are, thus, partly correlated with the carbon footprint.
LCA results are sensitive to the assumptions made in the respective studies. We identified and report here a variety of LCA modeling assumptions, starting with a deviating set of climate-relevant species. For quantifying the carbon footprint, the widely applied life-cycle inventory database ecoinvent (Version 2.2) considers more GHG emission species than the United Nations Framework Convention on Climate Change.47 The ecoinvent database provides the global warming impact factors of CO2, CO, N2O, SF6, 12 halogenated ethane derivates, CH4, as well as 15 halogenated methane derivates.48 The European Environmental Agency, on the contrary, considers only two species in addition to CO2 (namely CH4 and N2O) when quantifying the carbon footprint of diesel and gasoline fuel used for road transport.49 CH4 and N2O can together comprise up to 18% of the carbon footprint related to vehicle use, as Jungmeier50 reported for the vehicle use phase in China. Hence, the results of LCA studies can differ depending on how many of the relevant GHGs are captured in the life-cycle inventory.
Arguably most relevant for the carbon footprint of BEVs are CO2 emissions related to electricity production. The carbon intensity of electricity can vary greatly between regions and countries, depending on the local mix of resources used for electricity production. When charged with electricity of a carbon intensity of 467 g CO2 equiv/kWh (which resembles the carbon intensity of the electricity mix in the EU in 2008), a reference electric vehicle is associated with a WTW carbon intensity of 60–76 g CO2 equiv/km.51 A review of 25 LCA studies conducted by Hawkins et al52 suggests that the GHG emissions due to vehicle and battery production sum up to 30–62 g CO2 equiv/km. This finding suggests that the life-cycle carbon footprint of an electric car tends to be dominated by electricity production when charged with electricity of a carbon intensity of ~470 g CO2 equiv/ kWh.
The LCAs reviewed here reveal differences in the applied modeling approaches. For example, some authors set the carbon footprint of renewable electricity to zero, referring to it as “carbon-free electricity”.53,54 Such a rough approximation disregards the impacts of producing and installing renewable energy technologies. Electricity produced to 100% from wind energy is according to the ecoinvent database associated with a carbon footprint of 21 g CO2 equiv/kWh including transfer losses.44 Moreover, we regard it incorrect to assume in scenario analyses of a mid-term future renewable electricity mix that electricity is entirely produced by renewable energy technologies. In Central Europe, there will likely be a certain backup and base load provided by fossil or storage technologies. A realistic “renewable” future electricity mix for Germany may have a carbon intensity of 131 g CO2 equiv/kWh.44 Still, such a low carbon footprint of electricity causes the use-phase and life-cycle carbon footprint of BEVs to drop far below that of ICEVs (Figure 4).44,51,52
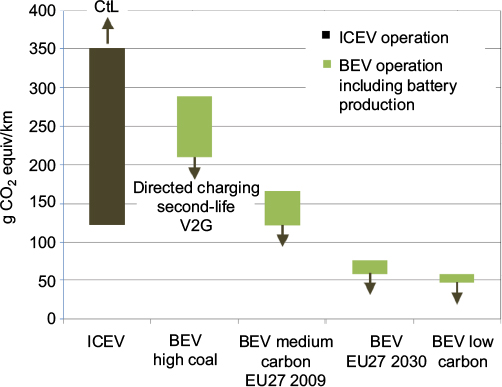 | Figure 4 Simplified carbon footprint comparison of BEVs and ICEVs considering the use phase and the impacts of battery production only. Notes: ICEV: the minimum value (122 g CO2/km; CO2 emissions considered here only instead of CO2 equiv, resulting in deviations of just 1–2%)15 is based on the assumption that on-road emissions are 41% higher than the certified 73 g CO2/km for the Toyota Prius IV62 and that carbon losses along the fuel production and distribution chain reach on average 18%.15 The maximum value (354 g CO2/km) assumes 13 L/100 km fuel consumption50 and likewise a supply chain losses of 18%. CtL: the use-phase carbon footprint can reach up to 787 g CO2/km when based on CtL fuel.112 BEV: electricity consumption at charging point is 19–27 kWh/100 km; “BEV high coal” scenario is based on 1002 g CO2 equiv/kWh in China.54 “BEV medium carbon” scenario is based on the EU27 electricity carbon footprint of 540 g CO2/kWh in 2009;40 “BEV EU27 2030” scenario assumes a carbon footprint of 211 g CO2 equiv/kWh (prediction);60 “BEV low carbon” scenario assumes a carbon footprint of 150 g CO2 equiv/kWh (rounded from Helmers et al44). We add 18.3 g CO2 equiv/km22 to each BEV scenario to account for the carbon footprint of the battery. Abbreviations: BEV, battery electric vehicle; CtL, coal-to-liquid; ICEVs, internal combustion engine vehicles; V2G, vehicle-to-grid. |
Variability in the carbon footprint of electricity can also result from considering the CO2 emissions of power plants without losses. The CO2 emissions factor of electricity consumption in Germany in 2013 is officially quantified as 584 g CO2/kWh55 – the authors specify CO2 but probably mean CO2equiv.56 In ecoinvent modeling, however, this amounts to 707 g CO2 equiv/kWh, because the own consumption of power plants and the losses from plant to plug are being considered.44 Moreover, most researchers base their modeling of the carbon footprint on the average GHG emissions of electricity production; others consider the marginal GHG emissions,57 which often tend to be higher than the former ones.
Due to regional heterogeneity in the electricity mix and the diversity in the assumptions made in the various LCAs, we depict the worldwide prevailing carbon footprint of BEVs and conventional vehicles on a simplified basis (Figure 4).
In comparative LCAs, there is a risk for underestimating the carbon footprint of conventional vehicles by assuming a too low fuel consumption.45 At the same time, BEVs tend to be modeled with a comparatively high urban electricity consumption (up to 30 kWh/100 km).50 The results in Figure 4 are based on the new European driving cycle (NEDC)-certified electricity consumption of electric as determined during type approval in the laboratory cars, ranging from 14.6 kWh/100 km to 20.7 kWh/100 km and covering vehicles from “mini” to luxury classes.58 Since research has shown that electricity consumption in reality is some 32% higher than during type approval,59 we add the 32% margin to the data presented by Ellingsen et al,58 calculating an electricity consumption of 19.2–27.3 kWh/100 km, which we take here as the basis for determining the use-phase carbon footprint of BEVs displayed in Figure 4.
“Medium-carbon countries” are considered those with an electricity generation carbon footprint compared to that in the EU27 in 2009 (Figure 4), which is projected to decrease by 61% until 203060 and would decrease proportionally the carbon footprint of BEVs (compare scenarios “BEV medium carbon” and “BEV EU27 2030” in Figure 4). “Low-carbon countries” include Austria, Sweden, Norway, and Iceland (Figure 4; green bar on the far right). High-carbon economies (eg, China, India, Australia, and Poland; specified as “high coal” in Figure 4; green bar on the far left) base the majority of electricity production on coal-fired power plants. Although the operation of BEVs in countries with a high share of coal in the electricity mix appears unfavorable on average (Figure 4), it should be noted that also for such countries, BEVs may be charged with electricity from a local photovoltaic device, as for example. Moreover, in China, ICEVs may be fueled with coal-to-liquid (CtL) fuels that can double or more than triple the carbon footprint of the use phase of conventional vehicles (Figure 4).
The use-phase carbon footprint of BEVs (including battery production) in the scenario “BEV medium carbon” coincides with that of the most efficient ICEVs available on the market (Figure 4). Thus, our review suggests already for the “BEV medium carbon” scenario a substantial reduction in GHG emissions when replacing ICEVs with BEVs (Figure 4). Moreover, the carbon footprint of EU electricity production will likely decrease in the midterm. Under the relevant scenario “BEV EU27 2030”, the carbon footprint of BEVs (including battery production) is 45% lower than the WTW carbon footprint of today’s most efficient ICEVs (ie, the Toyota Prius IV; Figure 4). In parallel, the use-phase carbon impacts of BEVs will decrease due to directed charging, second-life battery applications, and at a later point, vehicle-to-grid (V2G) applications (see Modeling the second life and V2G application section).
The life-cycle carbon footprint of ICEVs is clearly dominated by the use phase; for example, a mini-class car such as the “Smart” emits 81% of its CO2 equivalents during the use phase (mixed driving conditions, 100,000 km lifetime, substitution as end-of-life choice).44 Should a future reduction in the use-phase carbon footprint of ICEVs be considered in comparative LCAs? Not necessarily: a source of potential error is that scientists often base their footprint modeling on the certified CO2 emissions of ICEVs.61 The CO2 emissions of newly registered passenger cars (as certified over the NEDC) decreased by 27.6% between 2001 and 2014.62 In reality, however, the actual CO2 emissions (gram per kilometer) on the road decreased by 9% only and have been largely stagnating between 2010 and 2014.62,63 At the same time, the divergence between certification and real-world CO2 emissions increased from +10% to +40% between 2002 and 2014.62 However, only a few LCAs consider the real-life CO2 emissions of ICEVs so far.34,35,44,64
A comprehensive LCA covers the impact of gliders and drivetrains. However, in order to simplify and to unify data, there are also reasons to exclude gliders, which are discussed in detail by Moro and Helmers:22 gliders of BEVs and ICEVs are almost identical so far. Nevertheless, in LCAs, the gliders of BEVs have been associated with an extra weight of up to 100 kg.43 An extra weight in the order of 40 kg may be caused by the battery and engine management systems, charger, and extra wirings as it turned out in practical electrical conversion.65 Electric conversions of cars originally powered by combustion engines also exhibited that the weight of the electric engine equals that of the combustion engine replaced.45 The powertrain in a BEV tends to be simpler than that in a conventional vehicle because no or just a one- to two-gear transmission is required.44 On the other hand, the electric engine itself contains a larger number of metals66 with potentially higher environmental and health impacts compared to an internal combustion engine.43 The production of an electric engine may be associated with a three times higher carbon footprint than that of the combustion engine replaced.44,67 Hernandez et al68 highlighted the environmental benefits of abandoning rare earth elements (REEs) from electric engines for various impact categories.
It should be noted that in the long run, there will be BEVs with significant efficiency advantages over today’s electric vehicles. Simply shifting from the common single-speed transmission to a transmission with more gears can save up to 18% in energy consumption.69 On the other hand, BEVs can be equipped with in-wheel motors70 making gearbox, differential, clutch, and drive shafts unnecessary, thus decreasing the drivetrain losses.71 These effects can increase the range of a BEV by 14% for a given battery size.72 In omitting the mentioned parts of the drivetrain, future BEVs equipped with in-wheel motors can be reshaped offering the functionality of today’s vehicles while being smaller,73 which again reduces resources consumption. These opportunities seem to be not yet considered when extrapolating BEV technology development in LCA scenarios for 2030.43
The battery, however, always adds to the environmental impacts of BEVs relative to ICEVs. A few LCAs focused, therefore, particularly on the life-cycle impact of electric batteries.74–76 In review articles, a broad value range for the carbon footprint of battery production is reported (eg, 11–31 g CO2 equiv/km),77 variations being partly attributed to different modeling methods52 instead of different battery chemistries. The battery can account for up to 24% of the carbon footprint of the BEV’s whole life cycle (in case the battery is produced with carbon-intensive electricity in China).44 Switching the electricity supply for battery production to photovoltaics, as it is planned for Tesla’s gigafactory,78 would almost half the carbon footprint of battery production for a given chemistry compared to that in the previous scenario (unpublished results).79 A supply of low-carbon electricity as provided in Iceland for battery production can save up to 97% of the CO2 emissions of a contemporary battery factory located in China.80,81
BEVs entering the vehicle fleet today will be operated in the future with a continuously decreasing carbon footprint due to an increasing share of electricity produced from renewables.82 By contrast, aging ICEVs tend to drive increasingly unfavorable with respect to their carbon footprint (but even more so in view of their health and environmental impacts) as distance-specific fuel consumption and pollutant emissions tend to increase over time due to decreasing engine efficiency and more frequent malfunctions.83,84 The long-term impacts of aging and vehicle use pattern over the entire lifetime are generally neglected by LCA studies as BEVs and ICEVs are usually modeled based on a lifetime of on average 150,000 km.51 In reality, ICEVs achieve higher mileages, depending on the car segment on average between 170,000 km and 230,000 km (German market data).85 BEVs may also drive high mileages over their lifetime, but high uncertainty on battery lifetime and replacement intervals persist.51
The life-cycle impacts of technical parts of BEVs are to be expected to decrease much faster in the future than those for internal combustion engines. For example, the on-board electric infrastructure of BEVs is facing fast efficiency improvements: first-generation on-board-chargers were converting up to 40% of electricity into heat losses,45 while next-generation BEV inverters, chargers, and further electronic parts will be based on wide-bandgap semiconductors offering up to 98% energy efficiency.86,87 This is going to considerably improve the use-phase carbon footprint of BEVs in view of the 14% charging losses considered so far.44 Inductive charging, which is believed to be the future of charging BEVs, is presently disadvantaged with having an efficiency of 75%–80% only.88 On the other hand, scientists already realized inductive charging with 97.4% efficiency in the laboratory.89
Modeling the second-life battery and V2G applications
Another factor reducing the life-cycle carbon footprint of BEVs is being considered just in a few recent LCA studies: depleted batteries need not necessarily be recycled directly but may be turned over to a (stationary) second-life application. Reid and Julve90 identified 14 energy services that could be provided by second-life batteries and forecast an accumulation of second-life battery capacity of 100 GWh in Germany by 2030. Casals et al91 modeled a second-life application, revealing a state of health (SOH, which is defined as the available capacity of a fully charged battery as a percentage of its original full capacity)92 of 78% at the end of the first life (10 years) in a BEV. Then “the battery continues working in the second-life application until it achieves a final SOH of 60% (corresponding) to 8–20 years of additional use depending on the second-life application”.91 In case of charging with renewable electricity during the second life, the overall carbon footprint of the battery (in terms of kg CO2 equiv/kWh) can be decreased by up to 50%.91 Ahmadi et al93,94 concluded that GHG emission benefits of vehicle electrification could be doubled by extending the life of BEV batteries. Faria et al95 modeled that second-life applications can extend the overall life time of a battery by 1.8–3.3 years. Second-life applications are, however, found to be not always beneficial from an environmental point of view, because impacts are dependent on the carbon intensity of the electricity mix and on additional efficiency losses in the batteries.95 In addition, Richa et al96 investigated environmental effects when cascading lithium-ion battery life cycles and reported reductions in the net cumulative energy demand and in the carbon footprint by 15% under conservative estimates and by as much as 70% under ideal refurbishment and reuse conditions. However, before the widespread adoption of second-life applications, chemistry and construction of lithium-ion battery cells may need optimization. So far, cylindrical lithium-ion cells can suffer from sudden degradation after having lost some 20% of their original capacity during 800 full charging cycles.97 Factors leading to this sudden degradation of usable capacity are related to the depth of discharge, high charging currents and low temperatures, as well as unfavorable cell design, which is expected to be corrected in the future together with an optimized charging management protecting the cells over a longer life time.97
Future V2G applications are also expected to reduce the life-cycle carbon footprint of BEVs and the energy–mobility system in general. By allowing new charging strategies and “swarm aggregation”, BEVs can potentially transform the operative management and structure of the entire power grid.90 Few studies are available dealing with the LCA modeling of V2G applications.98 Zhao and Tatari99 confirmed that the inclusion of the V2G system significantly reduces the electricity supply emissions of BEVs, depending on the regulation service and the battery wear-out scenarios. Of particular future interest will probably be vehicle-to-home (V2H) applications: by bidirectional charging, electricity from a household’s PV system can be stored in a vehicle’s battery; later, the house hold can be supplied with electricity from the car. V2H systems can achieve this way high CO2 savings.100 Households and vehicles will have to be modeled together for their life-cycle impacts, ie, through expansion of the product system considered in the LCA. Twenty of the 27 EU member states use feed-in tariffs to support the adoption of household PV installations.101 V2H applications probably will be of widespread economic interest once these installations fall out of the initial tariffs in the forthcoming years.
Modeling the carbon footprint of a vehicle fleet
Several studies quantify the future GHG savings from the introduction of BEVs into the national car fleets. With the Norwegian extraordinarily low carbon footprint of electricity production (in the order of 5 g CO2/kWh according to IEA102), high savings are reachable within a short time: depending on the future market penetration of BEVs, already until 2020, up to 29% of life-cycle GHG emissions can be saved in the Norwegian road transport sector based on 39% BEVs in the vehicle fleet.103 An alternative scenario considering also the imported electricity in Norway’s grid suggests that up to 13% of life-cycle GHG emissions can be saved in the Norwegian road transport sector by 2020.103 Garcia et al104 reported that the penetration of BEVs into the Portuguese light-duty vehicle fleet can reduce the fleet-wide GHG emissions by 30%–39% in the period between 2010 and 2030, based on a share of up to 48% BEVs in the vehicle fleet, assuming electricity with a carbon footprint of 485 g CO2 equiv/kWh. Yabe et al105 modeled long-term CO2 savings of up to 63% for Japan, assuming a 90% share of BEVs in the vehicle fleet by 2049 and 100 g CO2 equiv/kWh electricity supply. As exhibited in these studies, future GHG savings due to the increasing diffusion of BEVs into the vehicle fleets vary considerably depending on the concrete scenario. Saving potentials can even be increased through directed charging of a larger BEVs fleet. In countries such as Germany where electricity is produced by a balanced mix of fossil (coal) and renewable energy sources, marginal WTW CO2 emissions could decrease by 31% from 110 g CO2/km to 76 g CO2/km for a standard BEV by optimizing the charging behavior, as Jochem et al106 have modeled for 2030.
Assessing the carbon footprint of BEVs in China
Interestingly, western LCA studies are throughout critical of deploying BEVs if electricity is carbon intensive, ie, produced predominantly from coal.67,76,107,108 Chinese LCA studies, however, partly quantify CO2 emission advantages for BEVs in their home country109 where electricity is largely produced from coal. A collaborative US–Chinese LCA study assessed the use of BEVs in six Chinese provinces as unfavorable with respect to their carbon footprint, which may, however, improve in the future because of advances in power plants’ emissions control.110 Wang et al,111 however, modeled the life-cycle impact of BEVs and plug-in hybrid vehicles in Beijing and reported 40%–57% GHG reductions but a life-cycle increase of PM2.5 emissions by 5% compared to that of ICEVs. However, these authors emphasized that the deployment of BEVs would decrease local air pollution because fine dust emissions would be shifted away from urban centers to less densely populated areas.111
By comparison, the WTW carbon footprint of ICEVs may double if fuels are produced via CtL technology rather than from crude oil.54 Yan and Crookes112 claimed that an ICEV driving with Chinese CtL fuel emits 717–787 g CO2/km on the fuel chain. By 2013, Chinese companies were running direct and indirect coal liquefaction plants with a capacity of 700,000 tonnes per year,113 which is, however, accounted only for 0.6% of China’s motor gasoline demand in 2014.13 Other sources reported that China already exceeded one million tons of CtL fuel production in 2012.114 Moreover, it has been reported that 16 new CtL plants, with a cumulative production capacity of >22 million tons, are already built, under construction, or in advanced planning stages, which could result in covering up to 20% of the liquid fuel demand in China.114 This development puts the use of BEVs in China, that are largely powered by coal-derived electricity, in a different perspective than the use of BEVs in Europe.
Toxic emissions and further environmental impacts
LCA does not only cover the energy use and carbon footprint of BEVs but can also consider additional impact categories. The assessment of these usually reveals a complex picture with a mixture of environmental benefits and burdens of BEVs relative to conventional ICEVs (Table 1). In the assessment of environmental and health-related impacts, the reviewed LCA studies either specify pollutant species115 or, as usually applied in the USA, pollution costs.33 European researchers, as a third approach, prefer to quantify aggregated impacts at the midpoint (emissions summarized and converted to a unified dimension relative to an environmental mechanism) and the endpoint level (impacts aggregated and dimensionless), with the most popular approach being the ReCiPe method.39
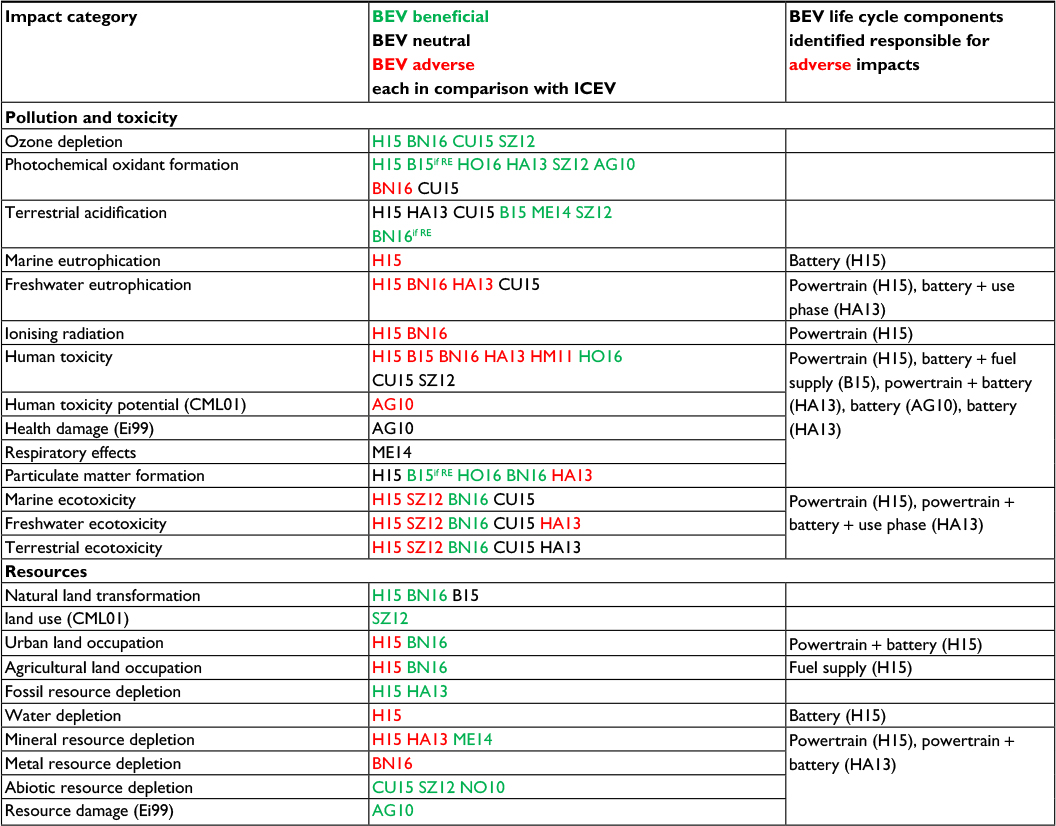 | Table 1 Life cycle assessment of impact categories other than carbon footprint on the midpoint level Notes: Citations in green, black, and red depict environmental and health-related advantages, neutrality, and disadvantages, respectively, of BEVs compared to ICEVs. H15, Helmers et al;44 B15, Bauer et al;43 HO16, Hooftman et al;137 BN16, Boren and Ny;138 CU15, Choma and Ugaya;139 ME14, Messagie et al;140 HA13, Hawkins et al;67 SZ12, Szczechowicz et al;32 HM11, Habermacher;21 NO10, Notter et al;26 AG10, Althaus and Gauch;141 Ei99 and CML01, impact assessment methods in case not ReCiPe analogous;48 if RE, impacts when BEV operated with renewable electricity related to the reference stated before. Abbreviations: BEV, battery electric vehicle; ICEV, internal combustion engine vehicle. |
Table 1 summarizes the results of selected LCAs, indicating benefits (green), neutrality, or adverse impacts (red) of BEVs in comparison to those of ICEVs (mostly according to the ReCiPe impact categories). Often the battery and the powertrain are identified for having adverse impacts (eg, with respect to freshwater eutrophication, urban land occupation, mineral resource depletion, and human toxicity) over the life cycle (Table 1). These impacts were quantified with respect to local conditions, particularly the local electricity mix. Because just eight studies modeled impact categories following the most recent understanding of a comprehensive LCA according to ReCiPe, we also added data from three earlier studies (Table 1). Accordingly, Table 1 considers the 18 impact categories quantified by ReCiPe, as well as comparable categories specified in earlier assessment methods.
The majority of impact categories addresses environmental pollution and toxicity effects, while a smaller group addresses resources depletion (Table 1).
Photochemical oxidant formation, terrestrial acidification, human toxicity, ecotoxicity, and particulate matter formation have been frequently assessed so far (Table 1). BEVs exhibit advantages over ICEVs with respect to ozone depletion, photochemical oxidant formation, and terrestrial acidification (Table 1). If further categories are considered, then additional adverse impacts of BEVs are identified (Table 1). Nevertheless, the single-score endpoint quantification due to the ReCiPe method reflects the advantages of BEVs over ICEVs, particularly when use-phase electricity is generated from renewable sources.44
Impact data over several categories (particularly the toxicity-related ones) show heterogenic results (Table 1). Yet, toxicity is typically assessed based on the mass of pollutants emitted or discharged; the assessment cannot, therefore, exactly quantify local human exposure to pollution. Just when it comes to the categories of eutrophication, water depletion, ionizing radiation, and metal depletion, BEVs show adverse effects relative to ICEVs; however, we note that for the later categories, data availability is scarce (Table 1).
Assessment methods such as ReCiPe enable quantifying endpoints, which represent an aggregation of several impact categories to the superior categories of human health, resource quality, and ecosystem quality. The single-score endpoint then summarizes all impacts. Helmers et al44 published midpoint as well as endpoint results. In this case, the single-score endpoint modeling of an ICEV and a BEV included different use-phase electricity supply alternatives and revealed a pattern quite similar to that of the carbon footprint.44
Yet, LCA data can reveal more information: process modules can be analyzed to identify subsystems that are critical for specific environmental or health-related impacts. Unfortunately, this information is rarely reported, so there is limited opportunity to identify components that are individually responsible for large parts of the adverse impacts related to BEVs (Table 1). Helmers et al44 find that the electricity consumption during battery cell manufacture in China can dominate the life-cycle impacts for the whole vehicle in the impact categories of particulate matter formation, marine eutrophication, terrestrial acidification, climate change, and photochemical oxidant formation. In another example, printed wiring boards and integrated circuits were identified having impacts able to dominate throughout the vehicles’ life cycle in the categories of mineral resource depletion, human toxicity, freshwater ecotoxicity, urban land occupation, freshwater eutrophication, and terrestrial acidification.44 This analysis demonstrated that not only the electric vehicle as such caused adverse impacts, but the conditions of battery cell production in China and the mode of wiring board production (which can be changed). Anyway, it is essential to identify such “hotspots” to be able to minimize the environmental impacts of BEVs.
Generic databases often lack information about location-specific impacts and resources (many data are “global”, which means worldwide averaged, as in the ecoinvent database, www.ecoinvent.org). This is no problem when quantifying the CO2 emissions either by car or by power plant because the radiative effect occurs relatively independent of the location at which emissions occur.
However, when assessing the health impacts of toxic emissions, exposure matters. Shifting pollutant emissions from numerous ICEVs in cities to electricity that is generated by power plants located remotely from cities, exposure to air pollution can be substantially reduced. Yet, LCA is still weak in accounting for exposure and needs to be complemented by further attempts in this regard.116 Again China represents an interesting case because 77% of the electricity is derived from coal power plants that tend to lack advanced pollution control.117 BEVs operated in Chinese cities cause higher (fueling) station-to-wheel PM2.5 emissions compared to ICEVs.117 Also, BEVs exhibited higher station-to-wheel NOx emissions than petrol cars.117 The picture, however, changes when exposure is accounted for to quantify health effects: even for largely coal-based electricity, BEVs’ use in Chinese cities leads to a decreased PM2.5 intake fraction,117 while the exposure to NOx emissions is comparable for ICEVs and BEVs.117 Also Chen and He118 confirmed the expectation that BEVs would improve air quality in China. Soret et al119 modeled air quality parameters in Spanish cities and found decreasing concentrations of PM, CO, and NO2 due to the introduction of BEVs. However, a high share of BEVs (26%–40%) is required to significantly improve urban air quality.119 Also, electricity supplied by a combined-cycle gas power plant inside the city border can lead to slightly increased NO2 concentrations in downwind areas.119 Donateo et al120 concluded for Italian cities that NOx, hydrocarbon, and PM emissions would be reduced by BEVs compared to conventional ICEVs, based on European emission legislation limits for conventional passenger cars. However, there is evidence since years that the NOx emissions of diesel cars are considerably higher on the road than during certification in the laboratory.15 Measurements with portable emissions measurement systems (PEMSs) and remote sensing devices suggest that diesel cars tend to emit roughly seven times more NOx than permitted by the applicable emissions limit.121–123
Noise pollution has received comparatively little attention in standardized LCA. While BEVs promise to greatly reduce traffic noise and related health impacts,124,125 safety issues may arise. These require careful consideration but are typically excluded from the evaluation of health impacts in LCAs so far.
Discussion and conclusions
Electric mobility will arguably play a decisive role in making road transport more sustainable. Ninety percent of passenger mobility could be based on renewable energy by 2050 in the EU.126 In that case, >50% of the final energy consumption in the transport sector across the EU27 could be saved in comparison to a business-as-usual scenario.126
LCA allows quantifying the environmental and health-related benefits and risks that may arise from shifting away from conventional fossil fuel-powered passenger cars to BEVs. LCA is the most comprehensive tool so far in this regard and opens the possibility to for optimizing and advancing the technological components to decrease the environmental and health impacts as well as resources consumption of BEVs. However, LCA has not been sufficiently used in this regard yet.
In this article, we have presented an overview of the environmental and health-related impacts of BEVs and we tried to identify areas of improvement for both LCA methodology and BEV technology. We have abstained from weighing the impacts of BEVs in the various categories. With multiple approaches at hand,127 weighing has been applied to compare the aggregate environmental impact of products.128 Weighing single impacts to each other is also regularly applied by the common LCIA methods during endpoint quantification, such as by ReCiPe,39 CML (Center of Environmental Science of Leiden University) and Eco-Indicator 99.48 Single impacts are being addressed by these LCIA methods with respect to the level of scientific understanding and also to some extent with respect to public interest. ReCiPe, as for example, considers the impact of global warming with a high mathematical relevance. In view of persisting controversies, we regard it the task of policy makers to weigh environmental and health-related impacts with respect to a given set of, generally location-specific, sustainability objectives.
The life-cycle impacts of BEVs as reported today reflect a snapshot in time of quick technical improvement, while ICEV technology is based on >100 years of mass production and continuous advancement. From the perspective of energy use and carbon footprint, BEVs in Europe are already environmentally competitive when not charged with predominantly coal-based electricity (the Chinese situation in particular; see Assessing the carbon footprint of BEVs in China section). To date, LCA data, however, also point to comparatively high environmental impacts of BEVs resulting from the production of the batteries and printed circuits. The problems are partly not BEV specific (printed circuit), but partly they are (impact of battery production). Battery technology, at the end, is currently facing innovation jumps. The evolution in design, production processes, and use pattern will likely contribute to an overall reduction in the environmental and health-related impacts of BEVs.
Our review identifies several reoccurring challenges in the LCA of BEVs (Figure 5) that demand further attention:
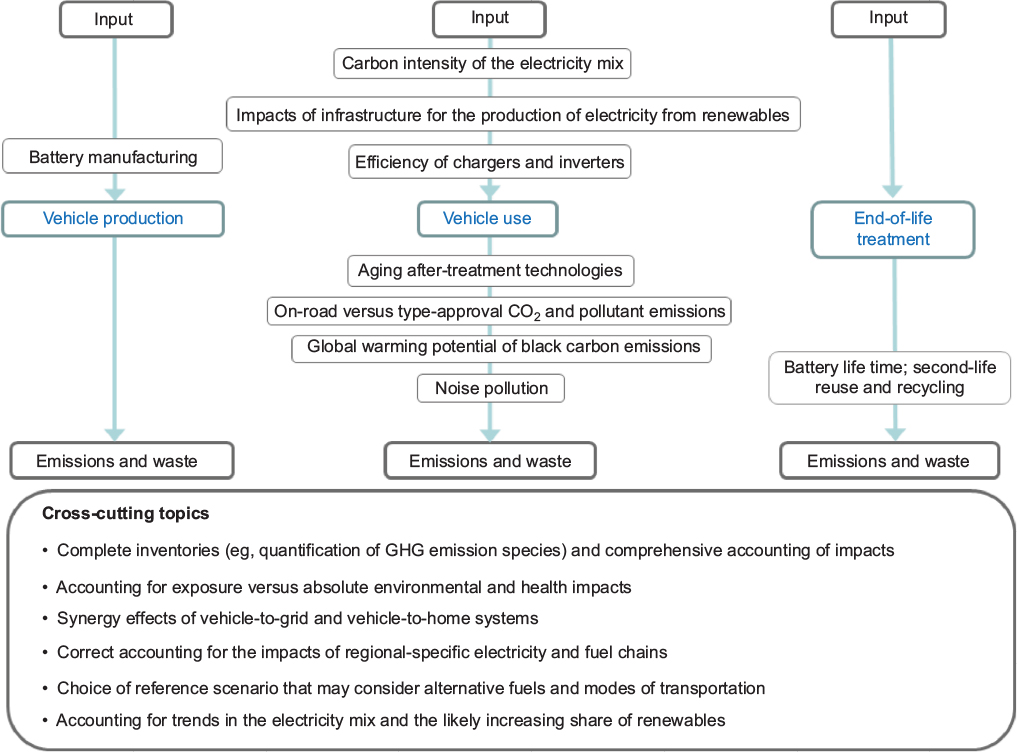 | Figure 5 Schematic overview of critical aspects in the comparative life-cycle assessment of BEVs and conventional cars. Abbreviations: BEVs, battery electric vehicles; GHG, greenhouse gas. |
Electricity mix – the carbon footprint of BEVs critically depends on the, generally location-specific, electricity mix. With carbon intensities of gross electricity production (excluding transmission and transformation losses) ranging in Europe from <20 g CO2 kW/h in Iceland and Norway to 1059 g CO2 kW/h in Estonia where electricity is produced from coal,129 the assessment of BEVs can result in a wide range of outcomes. For practical reasons, it can make sense to base an LCA of BEVs on the average carbon intensity of European electricity because Europe operates one integrated electricity grid.
Battery production – the environmental impact of battery production is subject to volatility26,77,130 because 1) the battery industry is under worldwide expansion and 2) there is uncertainty regarding the average life-time of batteries and the potential for second-life applications. We argue here that efforts will be needed in upcoming years to collect statistically representative data that allow for a more robust assessment of the life-cycle impacts of batteries used in BEVs.
GHG potential of black carbon emissions – the radiative forcing of black carbon, having a global warming potential of ~1000,131 is often not adequately considered when quantifying the carbon footprint of conventional cars, in particular diesel cars,48 which can introduce a bias into the comparative assessment of BEVs and conventional passenger cars.15 The political reason for neglecting black carbon is that it was not considered throughout the Kyoto process and its following amendments,132 although leading atmospheric scientists identified black carbon as being “the second most important human emission in terms of its climate-forcing in the present-day atmosphere”.133 Black carbon emissions from diesel cars may account for up to 50% of the GHG potential of the CO2 emitted during the actual vehicle use.15
On-road versus certified energy use – it has been frequently reported that both BEVs and conventional cars consume more energy on the road than during certification under standardized conditions in the laboratory. In case of conventional cars, deviations have reached some 40%62 and are expected to increase further with a hybridization of powertrains. In view of persisting discrepancies, we regard it important that the actual on-road energy consumption and CO2 emissions are used in the LCA of vehicles.
Assessment of life-cycle impacts – the performance of conventional cars tends to degrade with aging; in parallel, the electricity mix and fuel-supply chains may vary along the life cycle. For a correct assessment of the life-cycle impacts of BEVs and ICEVs, it is important to account for (likely) changes in the electricity mix and fuel supply as well as for the degrading efficiency and emission control technologies of conventional cars.
Reference scenarios – BEVs are thought to replace first and foremost conventional passenger cars. It is therefore reasonable to assess their environmental impacts relative to those of ICEVs. In comparative LCAs, a correct pairwise comparison (eg, BEVs versus conventional cars in a specific region or country) is critical but often hampered by limited data availability. Biases can result if inventory data of various regions are used within one LCA as the specific fuel- and energy-supply chains of a country may not be captured correctly.
Human exposure – LCA lacks spatially resolved data on exposure and impacts in (human) toxicity, which is needed to correctly asses the health-related impacts of BEVs in view of the worldwide pollution problems in cities. At this interface, LCA needs to be advanced.
Real-world inventories – It is striking that on the one hand, modeling approaches have already reached a high level of complexity. On the other hand, however, many inventories modeled until today are based on the generation 4 Volkswagen Golf materials cake published in 2000.44 The assumed materials cake should be updated and continuously modernized.
Database dependence – Trends in various impact categories seem to be stable even in case of inventory deviations.44 However, this may be due to the fact that the majority of modelers used the ecoinvent database. Results should be consolidated considering alternative databases.
Analytical depth – LCA modeling sometimes considers final results only. In scientific modeling, reasons for striking impacts can be identified by analyzing the process modules. This is rarely applied but the only way to locate why and which parts of the BEVs life-cycle or technology can or need to be improved and optimized.
Our review has highlighted the potentials and challenges in the LCA of BEVs. By making the current and potential future environmental impacts of BEVs transparent, LCA can help policy makers to come to informed decisions.
The worldwide rise of renewable electricity and imminent technological innovations will likely make BEVs in the future vastly superior over ICEVs in view of environmental friendliness and health impacts. The future developments will, in turn, need to be accompanied by a continuous updating of LCAs (specifically life-cycle inventory data) in the forthcoming years.
Acknowledgment
The authors thank Dr Adolfo Perujo, Dr Hisham Khatib and two anonymous reviewers for their comments on an earlier draft of this article.
Disclosure
The views expressed here are those of the authors and may not constitute the political position of the European Commission. The authors report no conflicts of interest in this work.
References
Lelieveld J, Evans JS, Fnais M, Giannadaki D, Pozzer A. The contribution of outdoor air pollution sources to premature mortality on a global scale. Nature. 2015;525:367. | ||
Schipper L, Deakin E, McAndrews C. Carbon dioxide emissions from urban road transport in Latin America: CO2 reduction as a co-benefit of transport strategies. In: Rothengatter W, et al., editors. Transport Moving to Climate Intelligence. Transportation Research, Economics and Policy. Berlin: Springer Science + Business Media; 2011;111–127. | ||
Intergovernmental Panel on Climate Change (IPCC) [webpage on the Internet]. Chapter 8: transport. 5th Assessment Report 2014, Working Group 3. 2014. Available from: http://www.ipcc.ch/report/ar5/. Accessed April 1, 2016. | ||
International Energy Agency (IEA) [webpage on the Internet]. Technology Roadmap Fuel Economy of Road Vehicles. 2012:50. Available from: https://www.iea.org/publications/freepublications/publication/technology-roadmap-fuel-economy-of-road-vehicles.html. Accessed April 1, 2016. | ||
Samaras Z, Vouitsis I. Reference Module in Earth Systems and Environmental Sciences. Climate Vulnerability: Understanding and Addressing Threats to Essential Resources, Vol. 3: Vulnerability of Energy to Climate Pages. Amsterdam: Elsevier; 2013:183–205. | ||
International Energy Outlook (IEO) [webpage on the Internet]. US Energy Information Administration, 2011. 2011. Available from: http://www.eia.gov/forecasts/ieo/world.cfm. Accessed July 23, 2016. | ||
Motowidlak U. Identification of behavioral changes in transport as a means for decarbonisation of the economy. In: Bąk M, editor. Transport Development Challenges in the Twenty-First Century. Berlin: Springer. Proceedings in Business and Economics Springer International; 2016;171–180. | ||
British Broadcasting Corporation (BBC) [webpage on the Internet]. Electric Cars Pose Environmental Threat. 2012. Available from: http://www.bbc.com/news/business-19830232. Accessed July 23, 2016. | ||
Marques P, Freire F. Comparative Life-Cycle Assessment of Electric and Conventional Vehicles in Portugal. 43rd LCA Discussion Forum. Zurich, Switzerland: 2011. | ||
Weiss M, Dekker P, Moro A, Scholz H, Patel MK. On the electrification of road transportation – a review of the environmental, economic, and social performance of electric two-wheelers. Transp Res Part D. 2015;41:348–366. | ||
International Organization for Standardization (ISO). Environmental Management – Life Cycle Assessment – Principles and Framework, 2006. ISO 14040. Geneva, Switzerland: ISO; 2006. | ||
International Organization for Standardization (ISO). Environmental Management – Life Cycle Assessment – Requirements and Guidelines, 2006. ISO/FDIS 14044. Geneva, Switzerland: ISO–International Organization for Standardization; 2006. | ||
International Energy Agency (IEA). Energy Technology Perspectives 2016. Released 1 June 2016. Available from: http://www.iea.org/etp/etp2016/. Accessed December 10, 2016. | ||
British Petroleum (BP). BP Energy Outlook 2030. London; 2011. Available from: http://www.bp.com/content/dam/bp/pdf/energy-economics/energy-outlook-2015/bp-energy-outlook-booklet_2011.pdf. Accessed October 31, 2016. | ||
Cames M, Helmers E. Critical evaluation of the European diesel car boom – global comparison, environmental effects and various national strategies. Environ Sci Eur. 2013;25(15):22. Available from: http://www.enveurope.com/content/pdf/2190-4715-25-15.pdf. | ||
International Energy Agency (IEA). Global EV Outlook 2015. 2015. Available from: www.iea.org/evi/Global-EV-Outlook-2015-Update_1page.pdf. Accessed April 17, 2016. | ||
Mock P, Yang Z. Driving Electrification – A Global Comparison of Fiscal Incentive Policy for Electric Vehicles. ICCT – The International Council on Clean Transportation; 2014. Available from: http://www.theicct.org/sites/default/files/publications/ICCT_EV-fiscal-incentives_20140506.pdf. Accessed May 24, 2016. | ||
Electric Vehicle Initiative (EVI). Outlook (2013). Understanding the Electric Vehicle Landscape to 2020. EVI; 2013. Available from: https://www.iea.org/publications/freepublications/publication/GlobalEVOutlook_2013.pdf.Accessed December 10, 2016. | ||
Oshiro K, Masui T. Diffusion of low emission vehicles and their impact on CO2 emission reduction in Japan. Energy Policy. 2015;81:215–225. | ||
Palencia JCG, Sakamaki T, Araki M, Shiga S. Impact of powertrain electrification, vehicle size reduction and lightweight materials substitution on energy use, CO2 emissions and cost of a passenger light-duty vehicle fleet. Energy. 2015;93:1489–1504. | ||
Habermacher F. Modeling Material Inventories and Environmental Impacts of Electric Passenger Cars [MS-thesis]; 2011. Available from: https://www.empa.ch/documents/56122/458579/MasterThesis_Habermacher.pdf/7d82e2fb-247c-4e6e-a549-32e82bda8a37. Accessed December 10, 2016. | ||
Moro A, Helmers E. A new hybrid method for reducing the gap between WTW and LCA in the carbon footprint assessment of electric vehicles. Int J Life Cycle Assess. 2015:1–11. | ||
JRC. Well-to-Wheels Analysis of Future Automotive Fuels and Powertrains in the European Context. WELL-TO-TANK Report. Version 2c. 2007. Available from: http://iet.jrc.ec.europa.eu/sites/about-jec/files/documents/TTW_Report_010307.pdf. Accessed October 31, 2016. | ||
United Nations Economic Commission for Europe (UNECE). Addendum 15 – Global Technical Regulation No 15. UNECE; 2014. Available from: http://www.unece.org/fileadmin/DAM/trans/main/wp29/wp29r-1998agr-rules/ECE-TRANS-180a15e.pdf. Accessed June 6, 2016. | ||
ReCiPe [webpage on the Internet]. Updated 2013 – A life Cycle Impact Assessment Method which Comprises Harmonised Category Indicators at the Midpoint and the Endpoint Level. ReCiPe Team; 2008. Available from: http://www.lcia-recipe.net/file-cabinet. Accessed June 24, 2016. | ||
Notter DA, Gauch M, Widmer R, et al. Contribution of Li-ion batteries to the environmental impact of EV. Environ Sci Technol. 2010;44:6550–6556. | ||
Del Duce A, Egede P, Öhlschläger G, et al. Guidelines for the LCA of Electric Vehicles. 2013. Available from: http://www.elcar-project.eu/fileadmin/dokumente/Guideline_versions/eLCAr_guidelines.pdf. Accessed October 31, 2016. | ||
Del Duce A, Gauch M, Hans-Jörg Althaus HJ. Inventories in ecoinvent version 3: electric passenger car transport and passenger car life cycle. Int J Life Cycle Assess. 2014. | ||
Faria R, Moura P, Delgado J, de Almeida AT. A sustainability assessment of electric vehicles as a personal mobility system. Energy Convers Manag. 2012;61:19–30. | ||
Leighty W, Ogden JM, Yang C. Modeling transitions in the California light-duty vehicles sector to achieve deep reductions in transportation GHG emissions. Energy Policy. 2012;44:52–67. | ||
Oxley T, Elshkaki A, Kwiatkowski L, Castillo A, Scarbrough T, ApSimon H. Pollution abatement from road transport: cross-sectoral implications, climate co-benefits and behavioural change. Environ Sci Policy. 2012;1(9–20):16–32. | ||
Szczechowicz E, Dederichs T, Schnettler A. Regional assessment of local emissions of EV using traffic simulations for a use case in Germany. Int J Life Cycle Assess. 2012;17(9):1131–1141. | ||
Traut E, Hendrickson C, Klampfl E, Liu Y, Michalek JJ. Optimal design and allocation of EV and dedicated charging infrastructure for minimum life cycle GHG emissions and cost. Energy Policy. 2012;51:524–534. | ||
Karabasoglu O, Michalek J. Influence of driving patterns on life cycle cost and emissions of hybrid and plug-in EV powertrains. Energy Policy. 2013;60:445–461. | ||
Noshadravan A, Cheah L, Roth R, Freire F, Dias L, Gregory J. Stochastic comparative assessment of life-cycle GHG emissions from conventional and EV. Int J Life Cycle Assess. 2015;20:854–864. | ||
Abdul-Manan AFN. Uncertainty and differences in GHG emissions between electric and conventional gasoline vehicles with implications for transport policy making. Energy Policy. 2015;87:1–7. | ||
Rangaraju S, de Vroey L, Messagie M, Mertens J, van Mierlo J. Impacts of electricity mix, charging profile, and driving behaviour on the emissions performance of BEV: a Belgian case study. Appl Energy. 2015;148:496–505. | ||
Onat NC, Kucukvar M, Tatari O, Egilmez G. Integration of system dynamics approach toward deepening and broadening the life cycle sustainability assessment framework: a case for EV. Int J Life Cycle Assess. 2016. | ||
Goedkoop M, Heijungs R, Huijbregts M, Schwryver AD, Struijs J, Van Zelm R [webpage on the Internet]. ReCiPe 2008 – A Life Cycle Impact Assessment Method which Comprises Harmonised Category Indicators at the Mid-point and the Endpoint Level. First Edition (Version 1.08), May 2013. Report I: Characterisation. Den Haag: Ministerie van VROM; 2013. Available from: http://www.lcia-recipe.net/file-cabinet/ReCiPe_main_report_MAY_2013.pdf?attredirects=0. Accessed April 16, 2016. | ||
Joint Research Centre (JRC). Tank-to-Wheels Report Version 4a, 2014. WTW Analysis of Future Automotive Fuels and Powertrains in the European Context. CONCAWE, EUCAR, JRC. 2014. Available from: http://iet.jrc.ec.europa.eu/about-jec/sites/iet.jrc.ec.europa.eu.about-jec/files/documents/wtw_report_v4a_march_2014_final.pdf. Accessed October 20, 2016. | ||
van Themsche S. Environmentally Conscious Society. The Advent of Unmanned EV. Switzerland: Springer International Publishing; 2016. | ||
Barreras JV, Pinto C, de Castro R, et al. A novel BEV concept based on fixed and swappable li-ion battery packs. 2015 Tenth International Conference on Ecological Vehicles and Renewable Energies (EVER), Monte Carlo March 31–April 2 2015. Piscataway, NJ: IEEE; 2015. | ||
Bauer C, Hofer J, Althaus HJ, Del Duce A, Simons A. The environmental performance of current and future passenger vehicles: LCA based on a novel scenario analysis framework. Appl Energy. 2015;157:871–883. | ||
Helmers E, Dietz J, Hartard S. Electric car LCA based on real-world mileage and the electric conversion scenario. Int J Life Cycle Assess. 2015:1–6. | ||
Helmers E, Marx P. Electric cars: technical characteristics and environmental impacts. Environ Sci Eur. 2012;24:14. | ||
United States Environmental Protection Agency (EPA) [webpage on the Internet]. Glossary of Climate Change Terms. 2016. Available from: https://www3.epa.gov/climatechange/glossary.html. Accessed June 25, 2016. | ||
UN Framework Convention on Climate Change (UNFCCC). Adoption of the Paris Agreement (2015), Proposal by the President, Draft Decision -/CP.21. 2015. Available from: http://unfccc.int/resource/docs/2015/cop21/eng/l01.pdf. Accessed April 1, 2016. | ||
Frischknecht R, Jungbluth N, Althaus H.-J, et al. Implementation of Life Cycle Impact Assessment Methods. ecoinvent report No. 3, v2.0. Swiss Centre for Life Cycle Inventories, Dübendorf, 2007. | ||
European Environmental Agency (EEA) [webpage on the Internet]. Annual European Union Greenhouse Gas Inventory 1990–2010 and Inventory Report 2012. Submission to the UNFCCC Secretariat. 2012. Available from: http://www.eea.europa.eu/publications/european-union-greenhouse-gas-inventory-2012. Accessed April 4, 2016. | ||
Jungmeier G. IEA HEV Task 19 – LCA of EV. Results of IEA HEV task 19 activities 2012 – 2015. Presentation on EA Expert Workshop “LCA of Electric Vehicles – Current Status and Future Perspectives”; November 11; 2015; Vienna. | ||
Nordelöf A, Messagie M, Tillman AM, Ljunggren M, Söderman JVM. Environmental impacts of hybrid, plug-in hybrid, and BEV – what can we learn from life cycle assessment? Int J Life Cycle Assess. 2014;19:1866–1890. | ||
Hawkins TR, Ola Moa Gausen OM, Strømman AH. Environmental impacts of hybrid and EV – a review. Int J Life Cycle Assess. 2012;17:997–1014. | ||
Nanaki EA, Koroneos CJ. Comparative economic and environmental analysis of conventional, hybrid and EV – the case study of Greece. J Cleaner Prod. 2013;53:261e266. | ||
Huo H, Wang M, Zhang X, et al. Projection of energy use and GHG emissions by motor vehicles in China: policy options and impacts. Energy Policy. 2012;43:37–48. | ||
Umweltbundesamt [webpage on the Internet]. Entwicklung der spezifischen Kohlendioxid- Emissionen des deutschen Strommix in den Jahren 1990 bis 2014 [Development of the specific carbon dioxide emissions pf the German electricity mix in the years 1990 to 2014]. Dessau-Roßlau: 2015. Available from: https://www.umweltbundesamt.de/publikationen/entwicklung-der-spezifischen-kohlendioxid-1. Accessed October 20, 2016. | ||
Umweltbundesamt. [Balance of emissions avoided by renewable energy sources in the year 2013] Emissionsbilanz erneuerbarer Energieträger. Bestimmung der vermiedenen Emissionen im Jahr 2013. Report 29/2014. 2014. Available from: https://www.umweltbundesamt.de/sites/default/files/medien/378/publikationen/climate_change_29_2014_schrempf_komplett_10.11.2014_0.pdf. Accessed October 20, 2016. | ||
Graff Zivin JS, Kotchen MJ, Mansur ET. Spatial and temporal heterogeneity of marginal emissions: implications for electric cars and other electricity-shifting policies. J Econ Behav Organ. 2014;107:248–268. | ||
Ellingsen LA, Singh B, Strømman AH. The size and range effect: lifecycle greenhouse gas emissions of electric vehicles. Environ Res Lett. 2016;11:1–8. | ||
The International Council on Clean Transportation (ICCT) [webpage on the Internet]. Electric Vehicles: Literature Review of Technology Costs and Carbon Emissions. Working Paper 2016-14. 2016. Available from: http://www.theicct.org/lit-review-ev-tech-costs-co2-emissions-2016. Accessed October 16, 2016. | ||
European Union (EU) [webpage on the Internet]. Communication from the Commission to the European Parliament, the Council, the European Economic and Social Committee and the Committee of the Regions. Brussels: Energy Roadmap 2050; 2011. Available from: http://eur-lex.europa.eu/legal-content/EN/ALL/;ELX_SESSIONID=pXNYJKSFbLwdq5JBWQ9CvYWyJxD9RF4mnS3ctywT2xXmFYhlnlW1!-868768807?uri=CELEX:52011DC0885. Accessed April 10, 2016. | ||
Ajanovic M, Haas R. Driving with the sun: why environmentally benign electric vehicles must plug in at renewables. Solar Energy. 2015;121:169–180. | ||
The International Council on Clean Transportation (ICCT). From Laboratory to Road. A 2015 Update of Official and “Real-World” Fuel Consumption and CO2 Values for Passenger Cars in Europe. White Paper. ICCT – International Council on Clean Transportation Europe; 2015:56. Available from: http://theicct.org/sites/default/files/publications/ICCT_LaboratoryToRoad_2015_Report_English.pdf. Accessed April 16, 2016. | ||
Haq G, Weiss M. CO2 labelling of passenger cars in Europe: status, challenges, and future prospects. Energy Policy. 2016;95:324–335. | ||
Ma H, Balthasar F, Tait N, Riera-Palou X, Harrison A. A new comparison between the life cycle GHG emissions of BEV and internal combustion vehicles. Energy Pol. 2012;44:160–173. | ||
Helmers E, Hild R. Electric Conversion. In press 2017. | ||
Helmers E. Possible resource restrictions for the future large-scale production of electric cars. In: Hartard S, Liebert W, editors. Competition and Conflicts on Resource Use, Natural Resource Management and Policy 46 (2015). Switzerland: Springer; 2015:121–131. | ||
Hawkins TR, Singh B, Majeau-Bettez G, Strømman AH. Comparative environmental LCA of conventional and EV. J Ind Ecol. 2013;17(1):53–64. | ||
Hernandez M, Messagie M, Hegazy O, Marengo L, Winter O, Van Mierlo J. Environmental impact of traction electric motors for electric vehicles applications. Int J Life Cycle Assess. 2015;1–12. | ||
Green Car Congress [webpage on the Internet]. Evolute Drives Test Results Show 18% Reduction in Energy Consumption with 3-Speed MSYS EV Transmission Compared to Single Speed. Green Car Congress, 20 August 2015. 2015. Available from: http://www.greencarcongress.com/2015/08/20150820-evolute.html. Accessed October 21,2016. | ||
Cakir K, Sabanovic A. In-wheel motor design for electric vehicles. 9th IEEE International Workshop on Advanced Motion Control. Piscataway, NJ: IEEE; 2006:613–618. | ||
Wang B, Xu M, Yang L. Study on the economic and environmental benefits of different EV powertrain topologies. Energy Convers Manag. 2014;86:916–926. | ||
Watts A, Vallance A, Whitehead A, Hilton C, Fraser A. The Technology and Economics of In-Wheel Motors. Warrendale, PA: SAE International 2010-01-2307; 2010. | ||
Heim R, Hanselka H, Dsoki E. Technical potential of in-wheel motors for EV. Cover story electromobility. ATZ Worldwide. 2012;114(10):4–9. | ||
McManus MC. Environmental consequences of the use of batteries in low carbon systems: the impact of battery production. Appl Energy. 2012;93:288–295. | ||
Olofsson Y, Romare M. LCA of lithium-ion Batteries for Plug-in Hybrid Buses [master of science thesis]. Gothenburg, Sweden: Chalmers University of Technology; 2013:133. ESA Report No. 2013:5. | ||
Dunn JB, Gaines L, Kelly JC, James C, Gallagher KG. The significance of Li-ion batteries in EV life-cycle energy and emissions and recycling’s role in its reduction. Energy Environ Sci. 2015;8:158–168. | ||
Ellingsen LA, Majeau-Bettez G, Singh B, Srivastava AK, Valøen LO, Strømman AH. LCA of a lithium-ion battery vehicle pack. J Ind Ecol. 2014;18(1):113–124. | ||
Sippel T [webpage on the Internet]. Managing Arising Barriers through the Involvement of Stakeholders in the First Stage of the Product-Life Cycle of EV. University of Twente Student Theses; 2015:14. Available from: http://purl.utwente.nl/essays/67417. Accessed April 15, 2016. | ||
Helmers E, Dietz J. New Sensitivities in LCA Modelling of Electric Cars. In press 2017. | ||
Tao PC. Potential Economic and Environmental Advantages of Lithium-Ion Battery Manufacturing Using Geothermal Energy in Iceland. Thesis MSc of Sustainable Energy. School of Science and Engineering at Reykjavík University, Iceland; 2011:118. | ||
Tao PC, Stefansson H, Harvey W, Saevarsdottir G. Potential Use of Geothermal Energy Sources for the Production of Lithium-Ion Batteries. World Renewable Energy Congress 2011. Linköping, Sweden: 2011:1289–1296. | ||
Faria R, Marques P, Moura P, Freire F, Delgado J, de Almeida AT. Impact of the electricity mix and use profile in the LCA of EV. Renew Sustain Energ Rev. 2013;24:271–287. | ||
Pillot D, Legrand-Tiger A, Thirapounho E, Tassel P, Perret P. Impacts of Inadequate Engine Maintenance on Diesel Exhaust Emissions. Paris: Transport Research Arena; 2014:4. | ||
Chen Y, Borken-Kleefeld J. NOx emissions from diesel passenger cars worsen with age. Environ Sci Technol. 2016;50(7):3327–3332. | ||
Weymar E, Finkbeiner M. Statistical analysis of empirical lifetime mileage data for automotive LCA. Int J Life Cycle Assess. 2016;21(2):215–223. | ||
Khaligh A, Dusmez S [webpage on the Internet]. Comprehensive Topological Analysis of Conductive and Inductive Charging Solutions for Plug-In EV. Vol. 61. IEEE Transactions on Vehicular Technology; 2012. Available from: http://ieeexplore.ieee.org/xpls/abs_all.jsp?arnumber=6266761&tag=1. Accessed October 31, 2016. | ||
Xue L, Shen Z, Mu M, et al. Bi-directional PHEV battery charger based on normally-off GaN-on-Si multi-chip module. 2014 IEEE Applied Power Electronics Conference and Exposition – APEC 2014. 16–20 March 2014. Piscataway, NJ: IEEE; 2014:1662–1668. | ||
Battery University [webpage on the Internet]. Pros and Cons of Wireless Charging. 2016. Available from: http://batteryuniversity.com/learn/article/charging_without_wires. Accessed October 16, 2016. | ||
Fraunhofer ISE [webpage on the Internet]. Cables No Longer Needed – High Efficiency Inductive Charger Developed for Electric Vehicles. 2013. Available from: https://www.ise.fraunhofer.de/en/press-and-media/press-releases/presseinformationen-2013/cables-no-longer-needed. Accessed July 22, 2016. | ||
Reid G, Julve J. Second Life-Batteries as Flexible Storage for Renewables Energies. Report by Digitalenergia.com. 2016:46. Available from: http://www.bee-ev.de/fileadmin/Publikationen/Studien/201604_Second_Life-Batterien_als_flexible_Speicher.pdf. Accessed July 23, 2016. | ||
Casals LC, García BA, Aguesse F, Iturrondobeitia A. Second life of electric vehicle batteries: relation between materials degradation and environmental impact. Int J Life Cycle Assess. 2015;1–12. | ||
Cannarella J, Arnold CB. State of health and charge measurements in lithium-ion batteries using mechanical stress. J Power Sources. 2014;269:7e14. | ||
Ahmadi L, Yip A, Fowler M, Young SB, Fraser RA. Environmental feasibility of re-use of EV batteries. Sustain Energy Technol Assess. 2014;6:64–74. | ||
Ahmadi L, Young SB, Fowler M, Fraser RA, Achachlouei MA. A cascaded life cycle: reuse of electric vehicle lithium-ion battery packs in energy storage systems. Int J Life Cycle Assess. 2015:1–14. | ||
Faria R, Marques P, Garcia R, et al. Primary and secondary use of electric mobility batteries from a life cycle perspective. J Power Sources. 2014;262:169–177. | ||
Richa K, Babbitt CW, Nenadic NG, Gaustad G. Environmental trade-offs across cascading lithium-ion battery life cycles. Int J Life Cycle Assess. 2015:1–16. | ||
Bach TC, Schuster SF, Fleder E, et al. Nonlinear aging of cylindrical lithium-ion cells linked to heterogeneous compression. J Energy Storage. 2016;5:212–223. | ||
Ercan T, Noori M, Zhao Y, Tatari O. On the front lines of a sustainable transportation fleet: applications of vehicle-to-grid technology for transit and school buses. Energies. 2016;9:230. | ||
Zhao Y, Tatari O. A hybrid LCA of the vehicle-to-grid application in light duty commercial fleet. Energy. 2015;93:1277–1286. | ||
Kudoh Y, Motose R, Tahara K, Genchi Y. A potential CO2 reduction of vehicle to home system from life cycle perspective. In: Proceedings of the IEEE Electric Vehicle Symposium and Exhibition (EVS27); November 17–20, 2013:1–10; Barcelona, Spain. | ||
Ragwitz M, Winkler J, Klessmann C, Gephart M, Resch G. Recent Developments of Feed-In Systems in the EU – A Research Paper for the International Feed-In Cooperation. 2012. Available from: http://www.feed-in-cooperation.org/wDefault_7/download-files/research/101105_feed-in_evaluation_update-January-2012_draft_final_ISI.pdf. Accessed July 23, 2016. | ||
International Energy Agency (IEA). Energy Policies of IEA Countries. Norway; 2011:146. Available from: http://www.iea.org/publications/freepublications/publication/norway2011_web.pdf. Accessed April 9, 2016. | ||
Singh B, Ager-Wick Ellingsen L, Strømman AH. Pathways for GHG emission reduction in Norwegian road transport sector: perspective on consumption of passenger car transport and electricity mix. Transp Res Part D. 2015;41:160–164. | ||
Garcia R, Gregory J, Freire F. Dynamic fleet-based life-cycle GHG assessment of the introduction of EV in the Portuguese light-duty fleet. Int J Life Cycle Assess. 2015;20:1287–1299. | ||
Yabe K, Shinoda Y, Seki T, Tanaka H, Akisawa A. Market penetration speed and effects on CO2 reduction of EV and plug-in hybrid EV in Japan. Energy Policy. 2012;45:529–540. | ||
Jochem P, Babrowski S, Fichtner W. Assessing CO2 emissions of EV in Germany in 2030. Transp Res Part A. 2015;78:68–83. | ||
Tessum CW, Hill JD, Marshall JD. Life cycle air quality impacts of conventional and alternative light-duty transportation in the United States. PNAS. 2014;111(52):18490–18495. | ||
Archsmith J, Kendall A, Rapson D. From cradle to Junkyard: assessing the life cycle GHG benefits of electric vehicles. Res Transp Econ. 2015;52:72–90. | ||
Zhou G, Ou X, Zhang X. Development of electric vehicles use in China: a study from the perspective of life-cycle energy consumption and GHG emissions. Energy Policy. 2013;59:875–884. | ||
Huo H, Cai H, Zhang Q, Liu F, He K. LCA of GHG and air emissions of EV: a comparison between China and the U.S. Atmos Environ. 2015;108:107–116. | ||
Wang HW, Zhang XB, Ouyang MG. Energy and environmental LCA of passenger car electrification based on Beijing driving patterns. Sci China Tech Sci. 2015;58(4):659–668. | ||
Yan X, Crookes RJ. Energy demand and emissions from road transportation vehicles in China. Prog Energy Combust Sci. 2010;36:651–676. | ||
Pei L, Linwei M, Guangjian L, Lingyin P, Zheng L. Coal-derived liquid fuels. CAERC, Tsinghua University, Sustainable Automotive Energy System in China. Berlin, Heidelberg: Springer-Verlag; 2013:187–216. | ||
Eenews [webpage on the Internet]. Chinese Companies Plunge into Coal-to-Liquids Business, Despite Water and CO2 Problems. 2015. Available from: http://www.eenews.net/stories/1060013819. Accessed April 10, 2016. | ||
Strecker B, Hausmann A, Depcik C. Well to wheels energy and emissions analysis of a recycled 1974 VW Super Beetle converted into a plug-in series hybrid EV. J Cleaner Prod. 2014;68:93–103. | ||
Kobayashi Y, Peters GM, Khan SJ. Towards more holistic environmental impact assessment: hybridisation of life cycle assessment and quantitative risk assessment. Procedia CIRP. 2015;29:378–383. | ||
Ji S, Cherry CR, Bechle MJ, Wu Y, Marshall JD. Electric vehicles in China: emissions and health impacts. Environ Sci Technol. 2012;46:2018–2024. | ||
Chen SM, He LY. Welfare loss of China‘s air pollution: how to make personal vehicle transportation policy. China Econ Rev. 2014;31:106–118. | ||
Soret A, Guevara M, Baldasano JM. The potential impacts of EV on air quality in the urban areas of Barcelona and Madrid (Spain). Atmos Environ. 2014;99:51–63. | ||
Donateo T, Licci F, D’Elia A, Colangelo G, Laforgia D, Ciancarelli F. Evaluation of emissions of CO2 and air pollutants from EV in Italian cities. Appl Energy. 2015;157:675–687. | ||
Weiss M, Bonnel P, Hummel R, Provenza A, Manfredi U. On-road emissions of light-duty vehicles in Europe. Environ Sci Technol. 2011;45:8575–8581. | ||
Weiss M, Bonnel P, Provenza A, et al. Will Euro 6 reduce the NOX emissions of new diesel cars? Preliminary conclusions from on-road emissions tests with Portable Emission Measurement Systems (PEMS). Atmos Environ. 2012;62:657–665. | ||
Carslaw DC, Rhys-Tyler G. New insights from comprehensive on-road measurements of NOx, NO2 and NH3 from vehicle emission remote sensing in London, UK. Atmos Environ. 2013;81:339–347. | ||
Cucurachi S, Heijungs R, Ohlau K. Towards a general framework for including noise impacts in LCA. Int J Life Cycle Assess. 2012;17:471–487. | ||
Jochem P, Doll C, Fichtner W. External costs of EV. Transp Res Part D. 2016;42:60–76. | ||
WBGU. World in Transition. A Social Contract for Sustainability, Flagship Report. German Advisory Council on Global Change (WBGU); 2011:420. Available from: http://www.wbgu.de/fileadmin/templates/dateien/veroeffentlichungen/hauptgutachten/jg2011/wbgu_jg2011_en.pdf. Accessed April 1, 2016. | ||
Huppes G, van Oers L. Background Review of Existing Weighting Approaches in Life Cycle Impact Assessment (LCIA). JRC67215. Ispra, Italy: European Commission – DG Joint Research Centre; 2011. | ||
Weiss M, Patel MK, Heilmeier H, Bringezu S. Applying distance-to-target weighing methodology to evaluate the environmental performance of bio-based energy, fuels, and materials. Resourc Conservat Recycl. 2007;50:260–281. | ||
IEA. CO2 Emissions from Fuel Combustion – Highlights. Paris, France: IEA – International Energy Agency; 2012. | ||
Majeau-Bettez G, Hawkins TA, Strømman AH. Life cycle environmental assessment of lithium-ion and nickel metal hydride batteries for plug-in hybrid and BEV. Environ Sci Technol. 2011;45(10):4548–4554. | ||
EPA. Black Carbon and Its Effects on Climate. 2016. Available from: https://www3.epa.gov/blackcarbon/2012report/Chapter2.pdf. Accessed October 20, 2016. | ||
United Nation and Nations UNIES. Doha Amendment (2012) Kyoto Protocol to the United Nations Framework Convention on Climate Change. Doha Amendment to the Kyoto Protocol. Doha, Dec 8, 2012. Adoption of Amendment to the Protocol. 2012. Available from: http://treaties.un.org/doc/Publication/CN/2012/CN.718.2012-Eng.pdf. Accessed April 4, 2016. | ||
Bond TC, Doherty SJ, Fahey DW, et al. Bounding the role of black carbon in the climate system: a scientific assessment. J Geophys Res. 2013;118(11):5380–5552. | ||
Weiss M, Patel MK, Junginger M, Perujo A, Bonnel P, van Grootveld G. Learning rates and price projections for hybrid-electric and battery-electric vehicles. Energy Policy. 2012;48:374–393. | ||
GAS2 [webpage on the Internet]. EV Sales Rose Significantly. GAS2 – Important Media Network. 2016. Available from: http://gas2.org/2016/03/09/ev-sales-rose-significantly-worldwide-2015/. Accessed May 24, 2016. | ||
OICA [webpage on the Internet]. 2005-2015 Sales Statistics. OICA – International Organization of Motor Vehicle Manufacturers; 2016. Available from: http://www.oica.net/category/sales-statistics/. Accessed May 24, 2016. | ||
Hooftman N, Oliveira L, Messagie M, Coosemans T, van Mierlo J. Environmental analysis of petrol, diesel and electric passenger cars in a Belgian urban setting. Energies. 2016;9(2):1–24. | ||
Boren S, Ny H. A strategic sustainability analysis of EV in EU today and towards 2050. Int Sch Sci Res Innov. 2016;10(3):237–245. | ||
Choma F, Ugaya CML. Environmental impact assessment of increasing electric vehicles in the Brazilian fleet. J Cleaner Prod. In press 2015. | ||
Messagie M, Boureima FS, Coosemans T, Macharis C, Van Mierlo JA. Range-based vehicle LCA incorporating variability in the environmental assessment of different vehicle technologies and fuels. Energies. 2014;7:1467–1482. | ||
Althaus HJ, Gauch M. Elektromobilität versus konventionelle Mobilität mit Bio und fossilen Treibstoffen. Dübendorf: LCA and Modelling Group, Technologie und Gesellschaft, EMPA; 2010:162. |
 © 2017 The Author(s). This work is published and licensed by Dove Medical Press Limited. The full terms of this license are available at https://www.dovepress.com/terms.php and incorporate the Creative Commons Attribution - Non Commercial (unported, v3.0) License.
By accessing the work you hereby accept the Terms. Non-commercial uses of the work are permitted without any further permission from Dove Medical Press Limited, provided the work is properly attributed. For permission for commercial use of this work, please see paragraphs 4.2 and 5 of our Terms.
© 2017 The Author(s). This work is published and licensed by Dove Medical Press Limited. The full terms of this license are available at https://www.dovepress.com/terms.php and incorporate the Creative Commons Attribution - Non Commercial (unported, v3.0) License.
By accessing the work you hereby accept the Terms. Non-commercial uses of the work are permitted without any further permission from Dove Medical Press Limited, provided the work is properly attributed. For permission for commercial use of this work, please see paragraphs 4.2 and 5 of our Terms.