")
Back to Journals » International Journal of Nanomedicine » Volume 10 » Issue 1
Accessing to the minor proteome of red blood cells through the influence of the nanoparticle surface properties on the corona composition
Authors Zaccaria A, Roux-Dalvai F, Bouamrani A, Mombrun A, Mossuz P, Monsarrat B, Berger F
Received 2 July 2014
Accepted for publication 11 October 2014
Published 9 March 2015 Volume 2015:10(1) Pages 1869—1883
DOI https://doi.org/10.2147/IJN.S70503
Checked for plagiarism Yes
Review by Single anonymous peer review
Peer reviewer comments 5
Editor who approved publication: Dr Thomas Webster
Affif Zaccaria,1,* Florence Roux-Dalvai,2,3,* Ali Bouamrani,1 Adrien Mombrun,1 Pascal Mossuz,4 Bernard Monsarrat,2,3 François Berger1
1Clinatec CEA-LETI, Grenoble, 2CNRS, IPBS (Institut de Pharmacologie et de Biologie Structurale), 3Université de Toulouse, UPS, IPBS, Toulouse, 4TIMC-Therex UMR 5525 CNRS, UJF, CHU Grenoble, Grenoble, France
*These authors contributed equally to this work
Abstract: Nanoparticle (NP)–protein interactions in complex samples have not yet been clearly understood. Nevertheless, several studies demonstrated that NP’s physicochemical features significantly impact on the protein corona composition. Taking advantage of the NP potential to harvest different subsets of proteins, we assessed for the first time the capacity of three kinds of superparamagnetic NPs to highlight the erythrocyte minor proteome. Using both qualitative and quantitative proteomics approaches, nano-liquid chromatography–tandem mass spectrometry allowed the identification of 893 different proteins, confirming the reproducible capacity of NPs to increase the number of identified proteins, through a reduction of the sample concentration range and the capture of specific proteins on the three different surfaces. These NP-specific protein signatures revealed significant differences in their isoelectric point and molecular weight. Moreover, this NP strategy offered a deeper access to the erythrocyte proteome highlighting several signaling pathways implicated in important erythrocyte functions. The automated potentiality, the reproducibility, and the low-consuming sample demonstrate the strong compatibility of our strategy for large-scale clinical studies and may become a standardized sample preparation in future erythrocyte-associated proteomics studies.
Keywords: nanoparticles, red blood cells, mass spectrometry, quantitative proteomics, protein corona, minor proteome
Introduction
With the emergence of nanotechnology, the engineering of “smart” nanoparticles (NPs) has opened up a host of possibilities in medicine and biology.1–3 Nevertheless, once injected in blood circulation, the fate of these NPs must be anticipated to prevent an NP-associated toxicity.4,5 When an NP is introduced into a biological fluid, it is well recognized that proteins immediately cover its surface, resulting in the formation of a protein “corona”, which will rapidly evolve according to the concentration and the affinity of proteins for the NP.6,7 Since the last decade, several studies used different analytical methods8 and focused on the performance of NPs in the presence of complex protein mixtures9–11 to demonstrate the complexity of these NP–protein interactions.12,13 First, the “nano-dimension” of these particles endows them with properties completely different from those of bulk materials with the same compositions. Moreover, NPs have a very large surface-to-volume ratio, so that even small amount of particles presents large surface areas available for protein binding. Finally, the physicochemical properties of NPs such as their size, their surface charge, or their chemical functionalization would determine their protein corona composition,11,14–17 which may more influence the biological response of the body.18,19 This capacity of NPs to concentrate at their surface different subsets of proteins according to their physicochemical properties may be useful in proteomics to improve protein detection and identification, and detect potential disease-associated species.20–22 In fact, despite the constant technological advances in mass spectrometry (MS) and sample fractionation methods, the limited dynamic range of current mass spectrometers hinders the entire proteome coverage of biological fluids in which the protein concentration range spans more than ten orders of magnitude.23,24 Thus, the low-abundant protein compartment where disease-associated biomarkers are thought to reside is still unattainable. Various nanomaterial-associated strategies25–28 have been integrated in MS in order to detect disease-associated biomarkers, and have been found extremely useful to improve protein enrichment and sample preparation, particularly NP-associated technology.29–31
Finding biomarker for disease detection, stratification, as well as therapeutic monitoring is a biomedical priority. Erythrocytes or red blood cells (RBCs) are a paradigmatic situation for clinical proteomics and also a major circulating compartment to individualize biomarkers.32,33 RBCs circulate all over the body and deliver oxygen to most organs. They are crucial micro-organites able to capture and provide remote biomolecular information at the periphery. They are also involved in hematological malignancies34,35 for which relevant biomarkers are still missing. Because of the presence of hemoglobin (Hb), which represents 98% of the total RBC soluble protein content and masks the 2% of biologically interesting low-abundant proteins, it is difficult to investigate the deep RBC proteome in clinical and large-scale studies. Although technical advances in RBC sample preparation and fractionation have greatly contributed to reduce the protein concentration range, allowing to increase the number of identified proteins by tandem MS (MS/MS),36,37 these approaches are time-consuming and require intensive fractionation on gel and large volumes of sample to be really efficient, thus limiting the clinical translation of such technologies for high-throughput large-scale studies. Until now, the capacity of NPs for protein enrichment in complex protein mixture has never been assessed with RBC proteins.
In the present work, the potential capacity of three kinds of NPs to capture RBC proteins was determined by a qualitative and quantitative proteomics analysis. Based on a fast experimental protocol that required low volume of RBC lysates, and without any fractionation step, nano-liquid chromatography (LC)–MS/MS analysis of the different NP-treated samples revealed 893 different proteins, demonstrating the interest of our nanoproteomics approach to analyze the RBC proteome in a large-scale context. We used label-free quantification38 to confirm the reproducibility and the influence of the NP surface on protein capture, highlighting subsets of proteins specific to each kind of NPs. Through this work, we demonstrated for the first time the interest of chemically modified NPs in sample preparation for RBC proteomics studies.
Methods
Magnetic NPs
Superparamagnetic NPs of 100 nm in aqueous suspension were obtained from Chemicell GmbH (Berlin, Germany). Three different kinds of NPs grafted with different matrices and functional groups were used in our study, fluidMAG-OS (OS-NP), fluidMAG-PAA (PAA-NP), and fluidMAG-Q (Q-NP) (Table 1). They have a multi-domain core allowing a fast and easy magnetic isolation by an external magnet (MagnetoPURE, Chemicell GmbH). More detailed features are available at http://www.chemicell.com/.
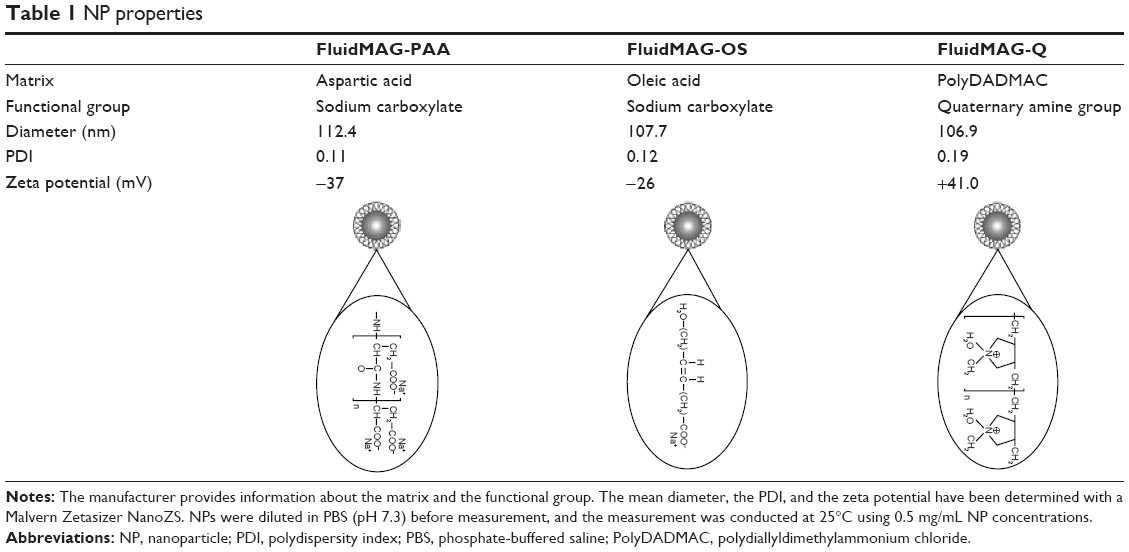 | Table 1 NP properties |
The size and zeta potential of the magnetic NPs were determined with a Malvern Zetasizer NanoZS. NPs were diluted in phosphate-buffered saline (PBS; pH 7.3) before measurement, and the measurement was conducted at 25°C using 0.5 mg/mL NP concentrations.
RBC preparation and lysis
Blood samples were collected from five healthy consenting donors, three men and two women aged 44–62 years (mean 55.4±7.7 years) by venipuncture in ethylenediaminetetraacetic acid vacutainer tubes. RBC lysis was performed according to the protocol previously published by Roux-Dalvai et al.37 Briefly, samples were firstly centrifuged at 1,000× g at +4°C for 10 minutes to eliminate plasma and buffy coat. To further eliminate leukocytes, a ficoll gradient separation was performed. After removal of the monolayer containing mononuclear cells, erythrocytes were carefully collected, avoiding top RBC layer and polynuclear cells collected in the pellet. Erythrocytes were then washed three times with PBS + PMSF (154 mM NaCl, 10 mM phosphate buffer, pH 7.4 containing 0.1 mM PMSF). At each step, along with supernatant, the upper RBC layer was removed.
The lysis of RBC was operated by hypotonic shock. Red cells were diluted to a 1:3 ratio with lysis buffer (5 mM phosphate buffer, pH 7.4 containing 1 mM ethylenediaminetetraacetic acid, and 0.5 mM PMSF) containing protease inhibitor and left in ice for 30 minutes. After freezing, red cells were thawed at 37°C. The procedure of freezing/thawing was repeated twice for each sample. At the end of the lysis step, after a centrifugation at 36,000× g for 10 minutes at +4°C, the clear supernatants were collected, pooled, and stored at −80°C until use.
RBC proteins–NPs incubation
Five hundred micrograms of each kind of NPs were individually incubated in two replicates for 45 minutes with 200 μL of hemolysate containing 1 mg of total protein. Then, NPs were attracted to one side of the vial by an external magnet, and supernatant was removed. NPs were washed three times in 500 μL PBS. Finally, NP-associated proteins were desorbed using 40 μL of 8 M urea −2% CHAPS, and the protein concentrations were determined by a Bradford protein assay (Bio-Rad Laboratories, Hercules, CA, USA).
Analysis of RBC lysate fractions by SDS-PAGE
Each sample was mixed with Laemmli buffer (4% sodium dodecyl sulfate [SDS], 20% glycerol, 10% 2-mercaptoethanol, 0.004% bromophenol blue, 0.125 M Tris-HCl). The mixture was heated in boiling water for 5 minutes and loaded on a precast 4%–15% polyacrylamide gel. Staining and destaining were performed with Coomassie blue and 30% ethanol/7% acetic acid in water, respectively.
LC–MS/MS analysis of RBC proteins
The Supplementary materials provide a detailed description of LC–MS/MS identification.
Briefly, 10 μg of each duplicated eluate and crude RBC lysate were separately diluted in Laemmli buffer and stacked in one band after a short and low-voltage electrophoretic migration on SDS-polyacrylamide gel electrophoresis (SDS-PAGE) gel. The stacking bands were cut, proteins were in-gel digested by trypsin, and resulting peptides were extracted from the gel and analyzed by nano-LC–MS/MS using an ultimate 3000 system (Dionex, Amsterdam, the Netherlands) coupled to an LTQ-Orbitrap Velos mass spectrometer (Thermo Scientific, Bremen, Germany). The LTQ-Orbitrap was operated in data-dependent acquisition mode with the Xcalibur software. Survey scan MS spectra were acquired in the Orbitrap in the 300–2,000 m/z range with the resolution set to a value of 60,000. The five most intense ions per survey were selected for collision-induced dissociation fragmentation, and the resulting fragments were analyzed in the linear trap quadrupole (LTQ).
Database search and data analysis
The Mascot Daemon software (version 2.3.0, Matrix Science, London, UK) was used to perform database searches against Homo sapiens entries in Uniprot protein database. The mass tolerances in MS and MS/MS were set to 5 ppm and 0.6 Da, respectively, and the instrument setting was specified as “ESI-Trap”. Mascot results were parsed with the in-house-developed software Mascot File parsing and Quantification (MFPaQ) v4.0.0 software (http://mfpaq.sourceforge.net/), and protein hits were automatically validated if they satisfied one of the following criteria: identification with at least one top-ranking peptide with a Mascot score of more than 39 (P-value <0.001) or at least two top-ranking peptides each with a Mascot score of more than 22 (P-value <0.05). When several proteins matched exactly the same set of peptides, only one member of the protein group was reported in the final list. To evaluate the false-positive rate in these experiments, all the initial database searches were performed using the “decoy” option of Mascot. Mascot results were parsed with the in-house-developed software MFPaQ v4.0.0 (http://mfpaq.sourceforge.net/), and protein hits were automatically validated.
Label-free quantification
Quantification of proteins was performed using the label-free module implemented in the MFPaQ v4.0.0 software (http://mfpaq.sourceforge.net/). For each sample, the software uses the validated identification results and extracted ion chromatogram (XIC) of the identified peptides in the corresponding raw nano-LC–MS files based on their experimentally measured retention time and monoisotopic m/z values. Quantification of peptide ions was performed based on calculated XIC area values. To compare the abundance profile of one protein in different samples, a protein abundance index (PAI) was calculated for each protein in the different NP samples. PAI was defined as the average of XIC area values for three intense reference tryptic peptides identified for this protein. If only one or two peptides were used to identify the protein, the protein-related PAI was calculated based on the XIC area value of these peptides. As the three different kinds of NPs were experimentally duplicated, six PAI values were obtained for each protein; the highest PAI value was normalized to 1, and the five other PAI values were thus comprised between 0 and 1. Normalized PAIs were submitted to software R for protein hierarchical clustering.39
Results
Magnetic NPs
In this study, we investigated the capacity of three different kinds of 100 nm NPs for protein capture in RBC lysates through the protein identification and quantification of their respective eluted corona. This size of NPs offers a high surface-to-volume ratio and facilitates the NP collection by an external magnet. The main difference between these NPs concerns their surface charge and/or functional group. First, according to dynamic light scattering and zeta potential measurements, the respective NPs were homogeneous in size and monodispersed. Q-NPs displayed a positive charge, and PAA-NPs and OS-NPs both displayed a negative charge (Table 1).
SDS-PAGE analysis
As particles fulfilled critical quality criteria, 500 μg of each kind of NPs, developing 280 cm2 surface area, were separately incubated in duplicates for 45 minutes with 200 μL of RBC lysates (ie, 1 mg of proteins), followed by extensive washing to remove all unbound proteins. First, the Bradford assays revealed 19±1 μg of proteins eluted from the surface of each kind of NPs, which represented 2% of the initial protein input. Prior to deeper characterization of each NP corona, the same quantity of proteins was loaded on an SDS-PAGE gel (Figure 1) to obtain a protein profile of each condition. For the three types of NPs, SDS-PAGE analysis of the eluted protein corona revealed a pattern obviously different from nontreated sample. Interestingly, the high-abundant Hb was considerably reduced, and the protein profiles of NP-treated samples revealed a great enrichment between 20 kDa and 250 kDa with the appearance of numerous bands, which were not detected in the control condition.
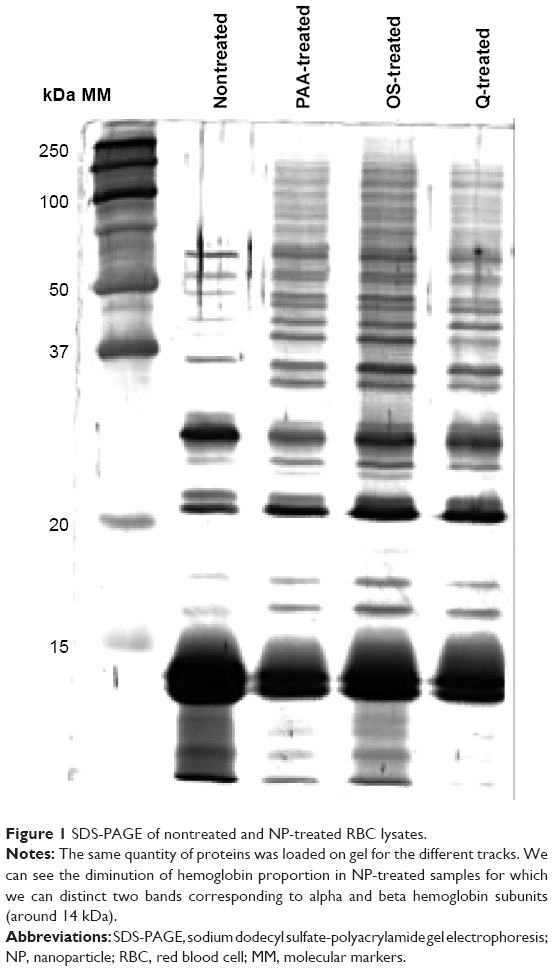 | Figure 1 SDS-PAGE of nontreated and NP-treated RBC lysates. |
Protein identification by nano-LC–MS/MS
To better estimate the protein enrichment offered by the NP treatment, a deeper characterization of each NP corona was performed by nano-LC–MS/MS protein identification. Figure 2A sums up the results obtained for each duplicated sample and gives an insight of the harvesting capacity for each condition. The different protein lists are detailed in the Supplementary materials. The two replicates of the crude RBC lysate revealed 108 different proteins, whereas two of the NPs-eluted coronae significantly highlighted more species (P=0.009, Mann–Whitney test), from 525 to 576 different species according to the type of NPs (Figure 2A). Altogether, 909 different proteins were identified from our RBC samples of which 893 were present in the list of NP-treated samples (Figure 2B). Among these 893 proteins, 801 were exclusively identified from NP-eluted coronae, and 92 were shared with crude RBC lysate. A focus on the three NP samples revealed a relatively similar number of identified proteins varying from 525 for OS- and Q-NPs to 576 for PAA-NPs, the three kinds of NPs only sharing 193 proteins (Figure 2C).
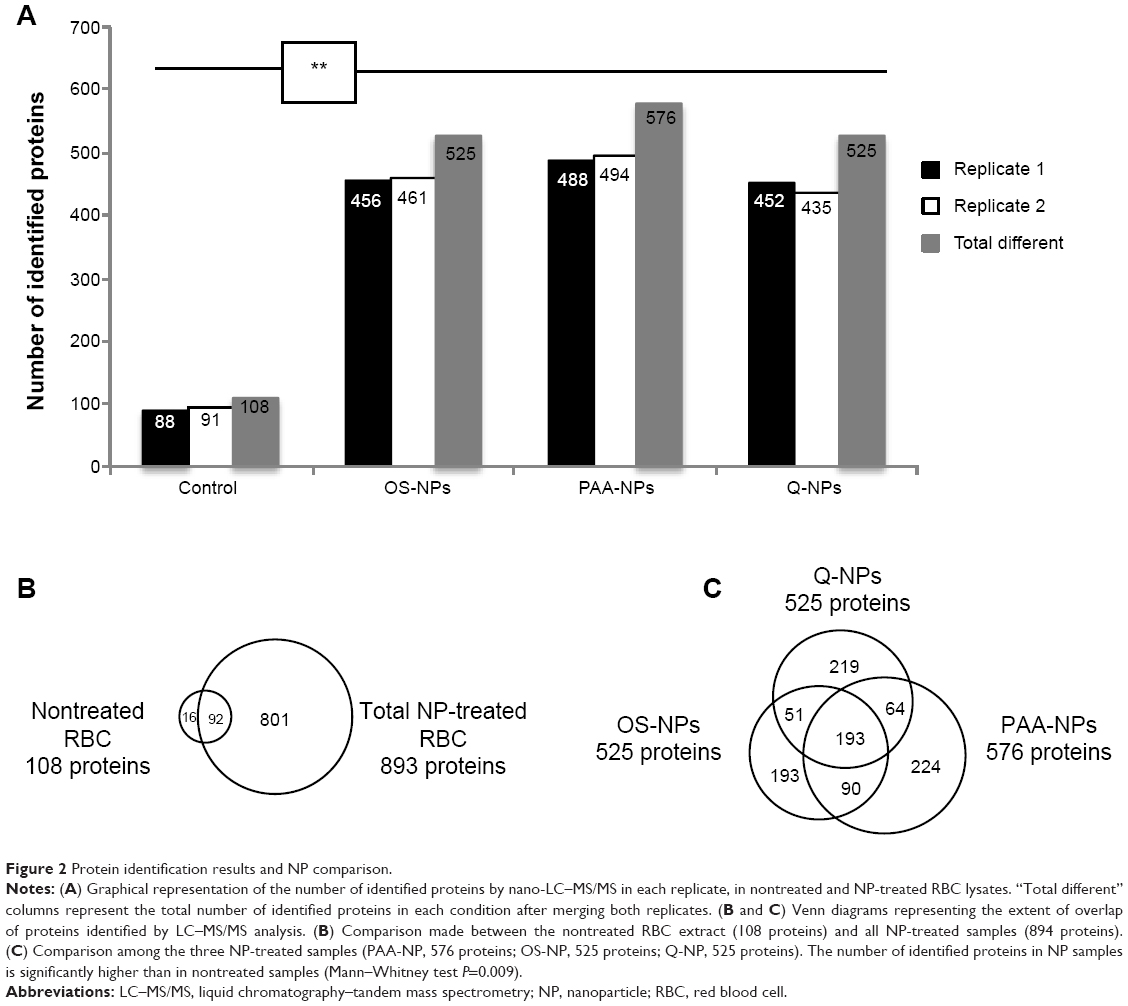 | Figure 2 Protein identification results and NP comparison. |
Effect of NP treatment on nano-LC–MS/MS analytical coverage
The nano-LC–MS/MS analysis showed that the NP treatment of the sample greatly enhanced the number of identified proteins; this must result from a better MS/MS sampling of the detected ions. To illustrate that effect, we compared the 20 most abundant identified proteins (ie, the 20 proteins with the higher MS/MS queries) in nontreated and NP-treated RBCs (Table 2 and Supplementary materials). Interestingly, according to the sample treatment, the 20 most abundant proteins were not strictly the same. In fact, only Hb-related subunits and spectrin chains, the two major constituents of RBCs, were shared by all conditions. Nevertheless, the rank and thus the relative abundance of these proteins were different. For example, Hb subunit beta and spectrin alpha chain that were respectively the first and the 20th most abundant protein in nontreated sample occupied the 5th and the 1st rank, respectively, in OS-NP sample. And carbonic anhydrase 1 that appeared just after the Hb-related subunits, as the 12th most abundant protein in nontreated RBC, only occupied the 70th rank in OS-NP sample. These results demonstrate that NP treatment modified the relative protein concentration in RBC sample. This modification of the protein abundance rank was also different according to the kind of NPs, suggesting the differential affinity of the NP surface for RBC proteins. Moreover, we also observed that the number of MS/MS queries assigned to these 20 most abundant proteins was greatly lower in NP-treated condition than in control. In control, 94% of the total MS/MS queries that were generated during the run were assigned to these 20 proteins, of which 91% to the Hb-related subunits. In the NP-treated sample, the 20 most abundant proteins only generated 42%–45% of the total MS/MS queries, of which 20%–29% were assigned to Hb-related subunits, according to the kind of NPs. This observation revealed that NP treatment greatly decreased the proportion of abundant proteins. Finally, for each kind of NPs, we showed that 90%–95% of the 20 most abundant proteins are the same between replicates. We also observed that the 20 most abundant proteins as well as Hb-related subunits generated the same part of MS/MS queries between replicates (Supplementary materials). These results confirmed the reproducibility of capture of each kind of NPs for these 20 most abundant proteins.
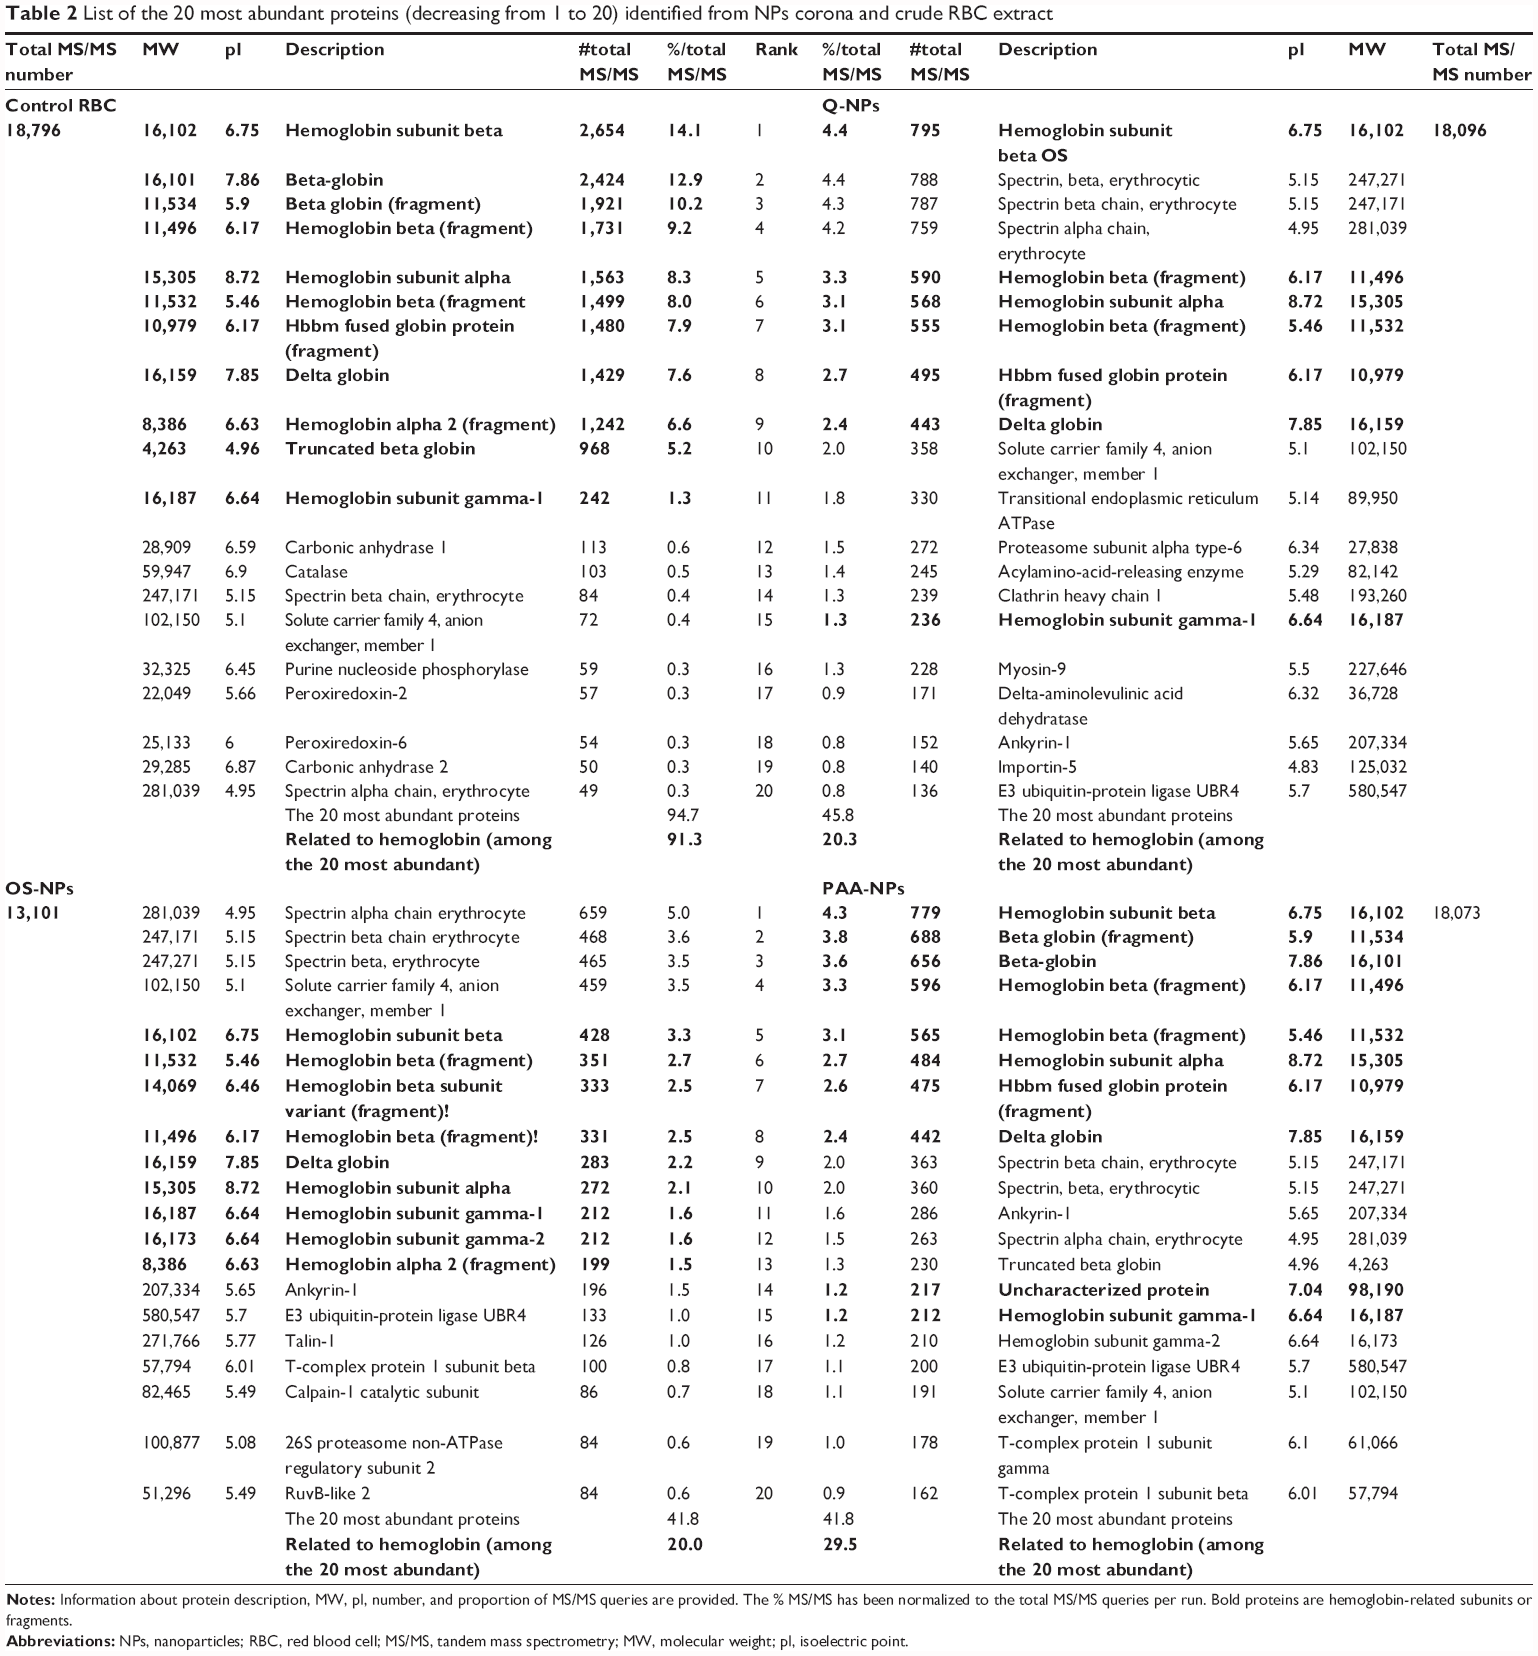 | Table 2 List of the 20 most abundant proteins (decreasing from 1 to 20) identified from NPs corona and crude RBC extract |
To determine whether NP treatment increased the proportion of low-abundant proteins in RBC samples, the MS/MS queries, the peptide number, and the sequence coverage of ten low-abundant proteins in nontreated sample (ie, proteins with low MS/MS queries) were determined in OS-NPs sample (Table 3). In nontreated sample, these ten low-abundant proteins generated from one to three MS/MS queries, with a low coverage of each protein sequence (from 1.4% to 17.1%). They represented 0.1% of the total MS/MS queries generated by the sample. In OS-NP samples, the same proteins generated from five to 63 MS/MS queries, allowing a greater coverage of the protein sequence (from 11.9% to 79.6%) through the detection and identification of different peptides for each protein. These ten proteins represented 2% of the total MS/MS queries generated by the NP-treated sample. This enhanced detection of low-abundant proteins was also observed in Q- and PAA-NPs (Supplementary materials). These observations clearly demonstrated that NP treatment also increased the proportion of low-abundant proteins.
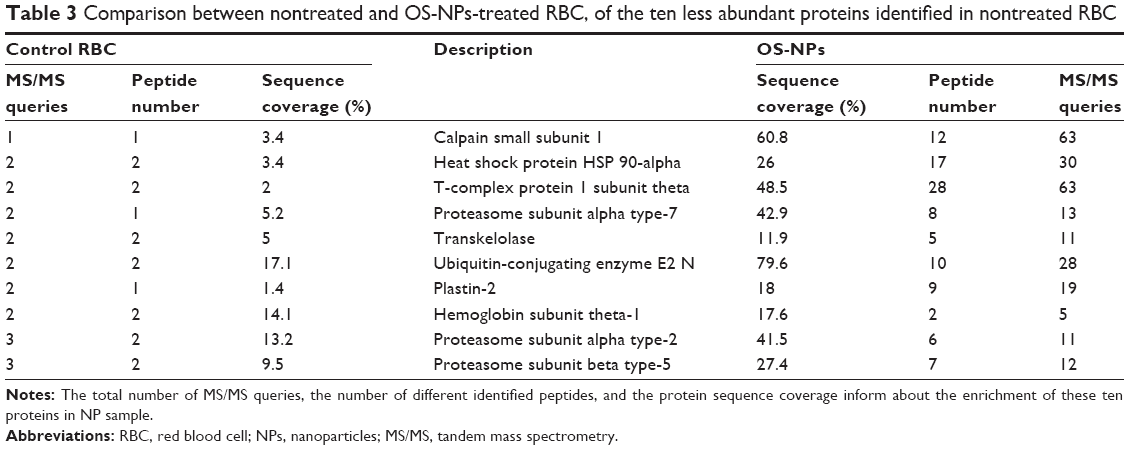 | Table 3 Comparison between nontreated and OS-NPs-treated RBC, of the ten less abundant proteins identified in nontreated RBC |
Qualitative and quantitative reproducibility in protein harvesting
Although NP-treated samples allowed a great increase in protein identification, providing access to low-abundant proteins, it was important to confirm the reproducibility of NPs for RBC protein harvesting. First, in a qualitative approach, we compared the MS spectra of each replicate and observed that the MS signal of 90%–94% of identified peptides was present in both replicates per type of NPs, thus confirming the qualitative reproducibility of NPs for protein harvesting (Figure 3A). Then, to assess the quantitative reproducibility of NP-strategy, we used the MFPaQ software,40 which was designed to parse and validate protein identifications from Mascot result files and quantify the identified proteins. The quantification module of MFPaQ v4.0.0 was upgraded so that it could handle label-free quantification as described by Mouton-Barbosa et al.41 More information is available in the Supplementary materials. Briefly, a PAI was calculated for all identified proteins. To assess the quantitative reproducibility of each type of NPs for protein harvesting, the PAI ratio of all identified proteins was determined in duplicates (Supplementary materials). As shown in Figure 3B, quantitative reproducibility of NPs was found to be good between the duplicates. In fact, the majority of quantified proteins on each kind of NPs revealed a PAI ratio close to the expected value of 1 (Supplementary materials).
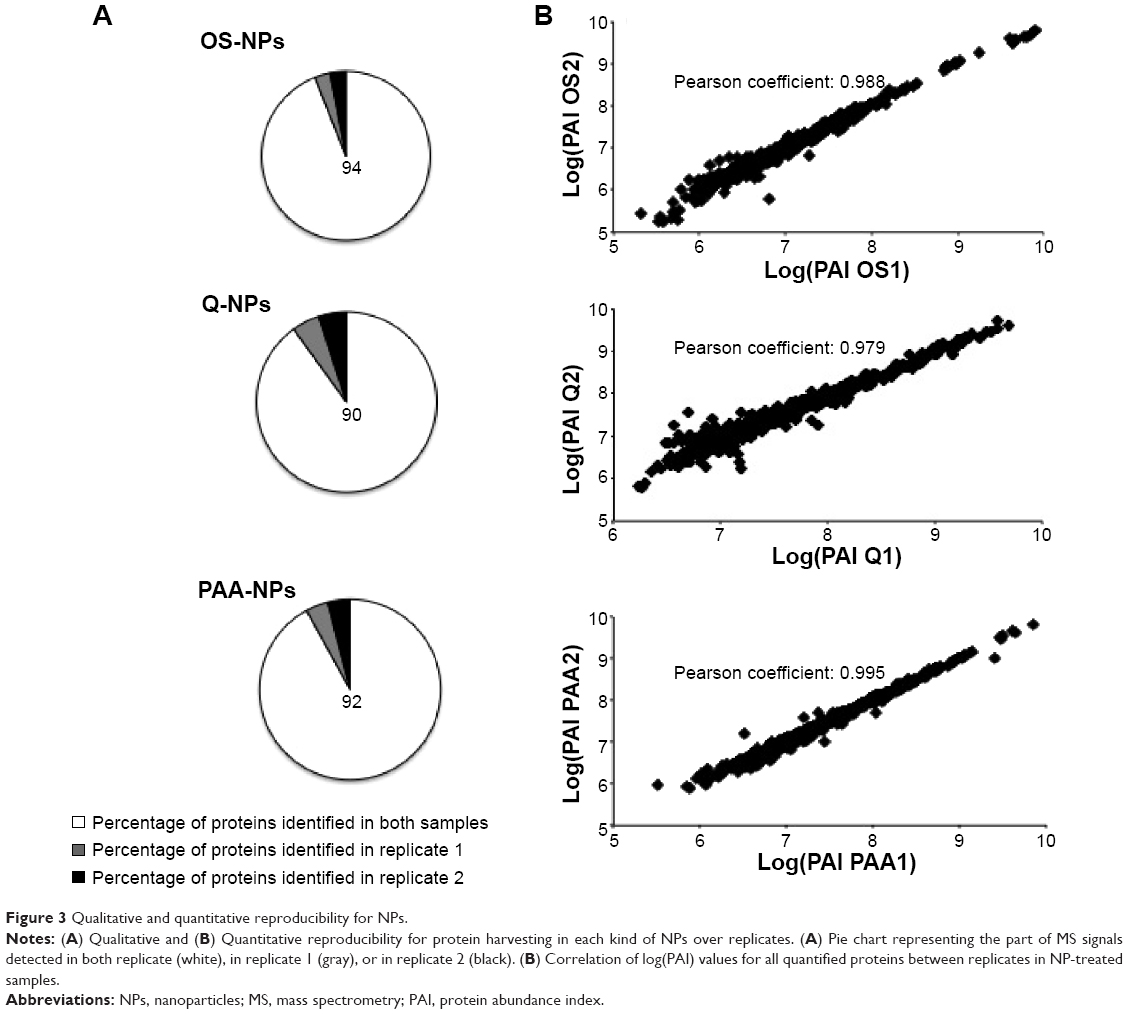 | Figure 3 Qualitative and quantitative reproducibility for NPs. |
Differential capture of proteins by the NP surface
As the protein capture by NPs was qualitatively and quantitatively reproducible, we aimed to determine if there was an NP-dependent protein harvesting. Based on these quantification results, we normalized the PAIs obtained for each protein in each sample and submitted them to hierarchical clustering with the software R. According to the PAI values of each protein in each condition, the clustering revealed ten differentially quantified protein groups (Supplementary materials ). Among them, groups 4, 5, and 8 revealed 68, 100, and 136 different proteins that specifically constituted the respective corona of Q-, OS-, and PAA-NPs (Figure 4A). To deeply characterize this protein capture specificity, we compared the molecular weight (MW) and the isoelectric point (pI) of proteins in these three groups. PAA-specific proteins revealed significantly higher MWs than OS-NPs (Figure 4B and Supplementary materials ). In fact, the median protein MW in PAA-group was 50,547 Da; it was only 33,667 Da in OS-group. Regarding the pI, the three protein groups showed significant differences (Figure 4C and Supplementary materials ). The positively charged Q-NPs revealed 90% of specific proteins that were negatively charged at pH 7.4 (ie, with a pI <7.4), whereas negatively charged OS- and PAA-NPs harvested less than 70% of specific protein with pI <7.4, confirming previous reports that suggested NP surface charge would influence the protein corona.
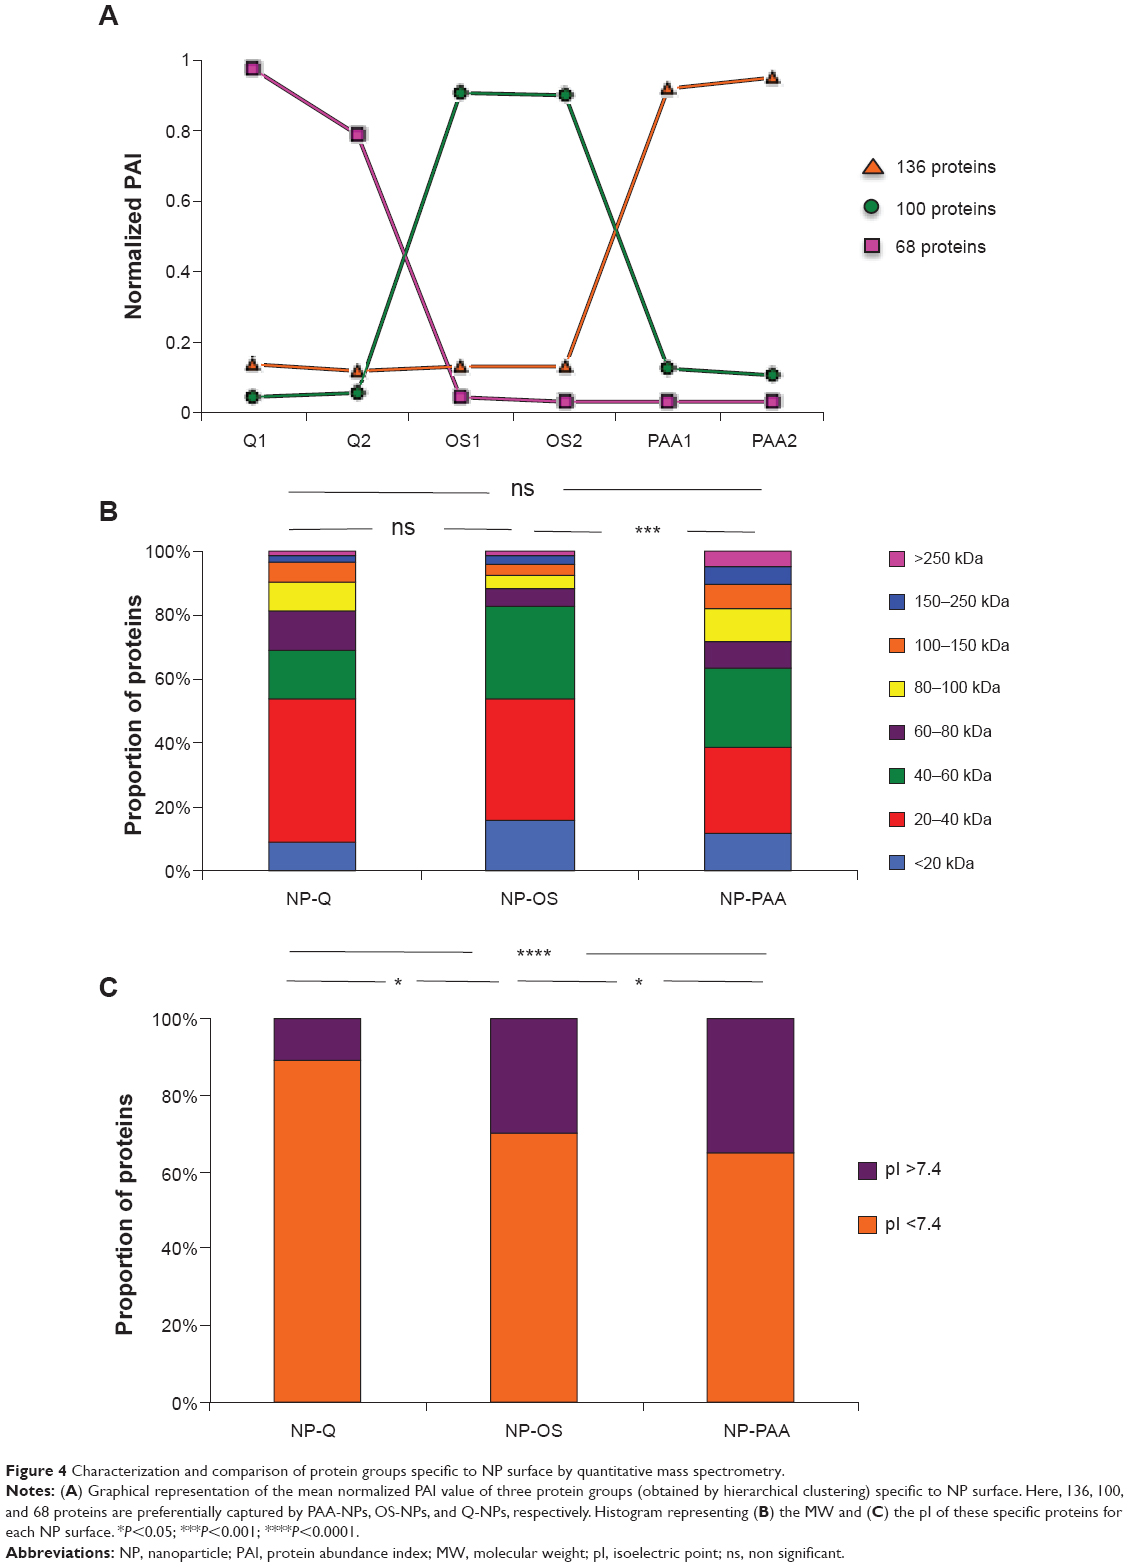 | Figure 4 Characterization and comparison of protein groups specific to NP surface by quantitative mass spectrometry. |
Functional analysis of RBC proteins
As NPs considerably increased the number of identified proteins in RBC samples and as the different surfaces harvested different subproteomes, we were interested in determining the functional pathways that were significantly represented by NP-harvested proteins in comparison with nontreated sample. In this aim, we submitted our data set to Ingenuity Pathway Analysis software42 (Ingenuity Systems, Redwood City, CA, USA) to perform the functional characterization of the RBC proteome and identify the main molecular pathways and networks. This automatic annotation tool uses a knowledge database and assigns proteins to functional classes or specific canonical pathways (CPs) related to various biological processes.
According to the functional analysis, the 893 proteins identified from the three different kinds of NPs had been associated to 140 different and significantly represented CPs and revealed 98 species related to hematological diseases; the 109 proteins from the crude extract only highlighted 40 different CPs and 31 proteins previously described in hematological diseases.
The ten more significant CPs for crude RBC lysate (Figure 5A) were related to the cellular origin and known functions of RBC. Most of them involved protein and nucleic acid degradation, anaerobic glycolysis, and response to oxidative stress. Although these ten CPs were not the most significant in NP-treated lysates, they were more represented in these samples than crude extract. Figure 5A shows the ratio of proteins identified in these ten CPs for crude and NP-treated RBC extracts. This ratio matches to the number of proteins from our data set that maps to the pathway divided by the total number of proteins referenced in this pathway by the software. We noticed in all CPs that these ratios were higher for the NP-treated samples, intending that NP increased the identification of proteins related to these CPs. On the other hand, when we considered NPs as the reference sample (Figure 5B), the ten more significant CPs were related to cellular assembly and organization of cytoskeleton, which play an important role in RBC. These pathways that are related to important RBC functions were almost absent from the set of proteins identified in the crude RBC sample, illustrating the impact of the enrichment following protein harvesting using NP technology.
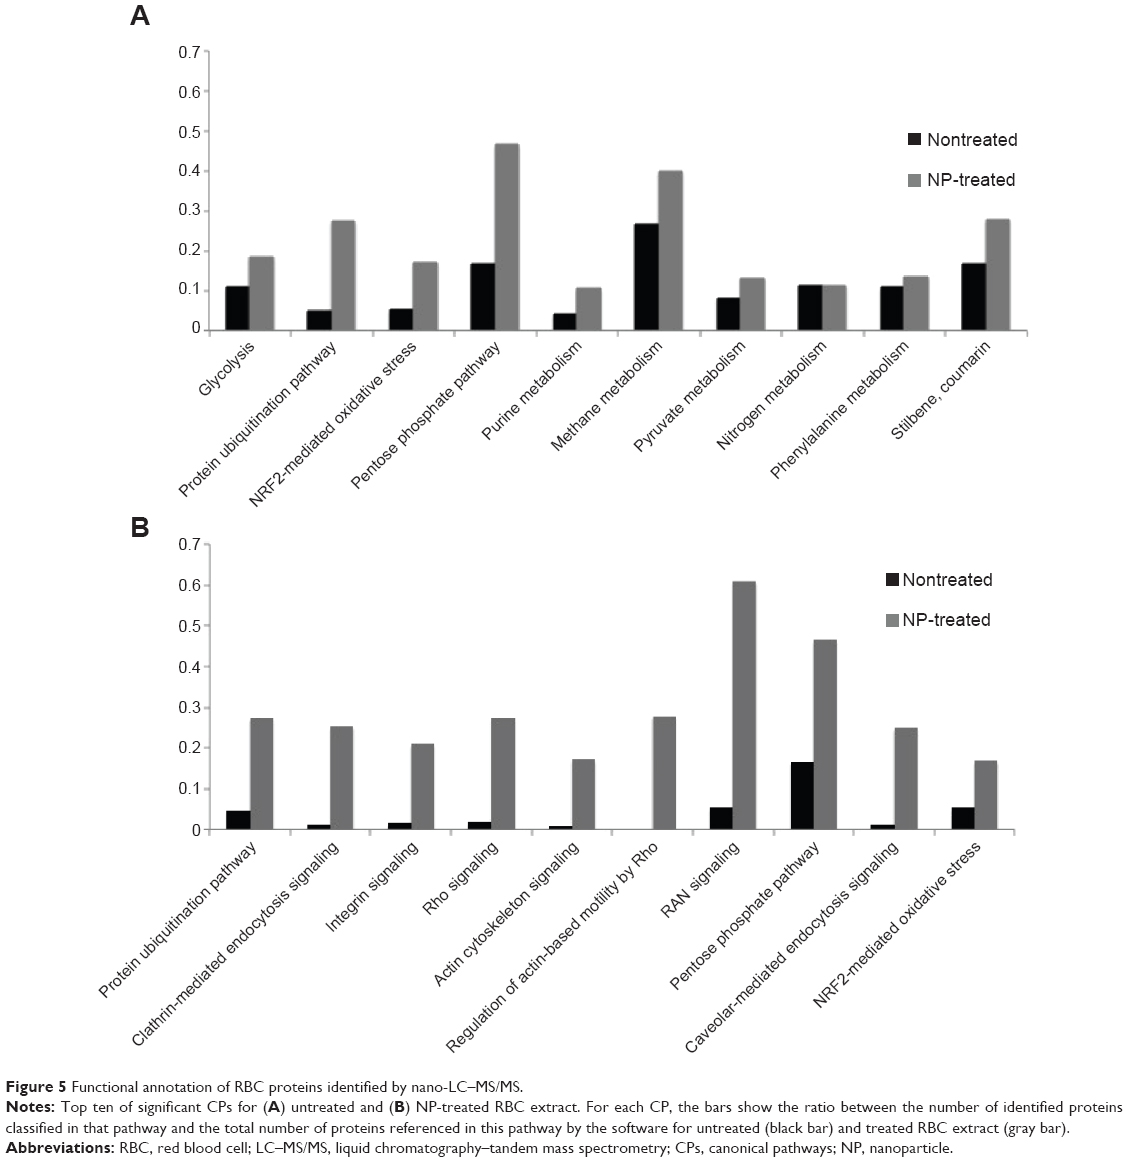 | Figure 5 Functional annotation of RBC proteins identified by nano-LC–MS/MS. |
Discussion
Although the behavior of NPs in the presence of complex protein mixture is still far from being completely understood, several studies have demonstrated that the physicochemical features of NPs greatly influenced the composition of their protein corona. In 2008, Lundqvist et al14 demonstrated, in plasma, qualitative differences in the protein corona of different types of NPs, according to the surface properties and the size of NPs. In 2012, Capriotti et al11 demonstrated that charge density on cationic liposomes influenced both qualitative and quantitative plasma protein capture. Recently, Tenzer et al15 performed both qualitative and quantitative proteomics to demonstrate that the NP size significantly determined the protein corona. Interestingly, they also demonstrated that the relative proportion of plasma proteins was modified on NP surface compared to their proportion in control plasma. These results suggest that different kinds of NPs may harvest different subproteomes and modify the range of protein concentration in complex samples. As these two properties may be helpful in proteomics approaches to increase the proteome coverage of a biological sample, we assessed for the first time the ability of chemically modified NPs to increase protein identification in RBC samples. The challenge with RBC sample is to decrease the concentration of Hb, which represents 98% of the total protein concentration. NPs provide great advantages for ex vivo experiments; their functionalized surfaces, their nanometer size, and their great surface-to-volume ratio endow them with unique physicochemical properties making them very attractive for protein harvesting.
In this study, we used three kinds of 100 nm superparamagnetic NPs that strongly differ in their surface chemistry. The magnetic properties of these NPs considerably facilitated their handling during washing and elution steps through the use of an external magnet. We selected a strong anion exchanger (Q-NP), a strong cation exchanger (PAA-NP), and a hydrophobic (OS-NP) surface to increase the probability to harvest different subsets of proteins. After the incubation of NPs with RBC protein extract, the nano-LC–MS/MS analysis of each eluted corona enabled the identification of more than 500 proteins, increasing by 400% the number of identified species compared to a control extract of RBC (108 proteins). Actually, synergic effects occurring at the NP surface can explain this improvement in protein identification. First, the proportion of high-abundant proteins is decreased on NP surface. Moreover, as observed by Tenzer et al35 the abundance rank of proteins (estimated by the number of MS/MS queries) was different between NP-treated and untreated sample. These results confirm that NPs modify the range of protein concentration at their surface. Interestingly, the 20 most abundant proteins harvested by NPs were also different according to the NP chemical functionalization (Supplementary materials ). This observation confirms that the affinity of each protein may be different according to the NP properties, influencing the protein concentration on the NP surface. The second effect concerns the increase of low-abundant proteins on NPs. In fact, we observed that low-abundant proteins identified in nontreated sample were present in higher abundance on NPs. Here also, the higher affinity of several low-abundant proteins for the different kinds of chemical functionalization allowed their accumulation on the NP surfaces. Thus, through the respective decrease of high-abundant proteins and increase of low-abundant proteins, NP treatment greatly reduces the range of concentration in the sample, making detectable more peptides by the MS instruments. Moreover, because RBC proteins have different affinities for the three kinds of NPs, distinct subproteomes were harvested on each surface, and we finally identified a total of 893 different proteins from these three types of NPs. Among these 893 identified proteins, label-free quantification allowed us to determine which were NP-specific protein signatures. Focusing on the MW and the pI, we found significant differences between these three NP-specific protein groups. While the positively charged Q-NP revealed 90% specific proteins with pI <7.4 (ie, negatively charged at pH 7.4), the negatively charged OS and PAA-NPs bound less than 35% of specific proteins with pI >7.4. We also observed that PAA-NPs harvested specific proteins with higher MW than the ones harvested by OS-NPs. According to these results, we confirmed that properties such as surface charge or chemical functionalization impact on NP–protein interaction.
Although the complexity of the NP–protein interactions is far to be understood, an NP-associated sample preparation of RBC samples in clinical proteomics appears obvious. During its 4-month life span, RBC travels along the entire blood stream to deliver oxygen to most organs. As a major circulating compartment, it is considered as a crucial micro-organite able to contain biomarkers associated both to hematological and non-hematological disorders.33 In the aim to detect protein modifications in pathological context, the access to the RBC proteome is a major issue to identify potential therapeutic targets. Although technical advances in RBC sample preparation and fractionation have greatly contributed to a better proteome coverage in RBC samples, they remain both time- and sample-consuming and thus incompatible with large-scale clinical studies. We demonstrated that our NP treatment is a very reproducible strategy that specifically allowed the access to the RBC minor proteome. Thus, signaling pathways highlighted in nontreated sample and implicated in important RBC functions such as oxygen transport, glycolysis, and protection against oxidative stress were more represented by NP treatment, offering the possibility to better understand mechanisms responsible for dysfunctions of these key functional pathways. Moreover, NP treatment specifically highlighted RhoA, Rac, and Cdc42 signaling that have essential functions in morphology and deformability regulations of the erythrocyte cytoskeleton.43,44 The maintenance of normal deformability is crucial to permit RBC to enter into narrow capillaries, and dysfunctions of these pathways have been associated with hemolytic anemia. Access to such mandatory pathways for erythrocyte functions would greatly improve investigations on erythrocyte disorders. This access to the minor RBC proteome could also provide precious information for non-hematological disorders. For instance, the specific identification by NP treatment of alpha-synuclein and DJ-1,45 two major proteins associated to Parkinson’s disease,46,47 may open the way to new proteomics analysis of RBCs in this disease.48,49
Finally, one great advantage of our approach, in comparison with immuno-depletion36 or Proteominer,37 concerns its efficiency from low volume of sample (200 μL of RBC containing 1 mg of protein). In their study, Ringrose et al36 and Roux-Dalvai et al37 both performed on-gel fractionation after immuno-depletion or Proteominer, and identified 700 and 1,578 different proteins from 200 mg and 5.7 g of starting material, respectively. We would certainly identify more proteins if we had combined such fractionation to NP treatment. Although getting high quantity of RBC proteins is not a limiting factor, as 50 mL of total blood could be easily obtained, the possibility to work on low volumes is more compatible with clinical-automated facilities. And the magnetic feature of NPs allowed us to easily automate all the experimental protocol. Villanueva et al50 have already described this kind of platform and demonstrated the reproducibility of NPs for protein harvesting, suggesting the ability to simultaneously process hundreds of samples in reproducible and clinically adapted conditions.
Conclusion
For the first time, we took advantage of the complexity of the NP–protein interactions to increase the proteome coverage in RBC lysates, via the capture of complementary subproteomes on different kinds of NPs. Through a qualitative and quantitative proteomics approach, we confirmed the impact of the NP surface functionalization and charge on protein capture, both demonstrating the reduction of the sample concentration range on the NPs and the specificity of capture for each surface. These synergic effects opened a window on the RBC minor proteome, which is a major issue to identify biomarkers associated to hematological and/or non-hematological disorders.
Disclosure
The authors report no conflicts of interest in this work.
References
Sanvicens N, Marco MP. Multifunctional nanoparticles – properties and prospects for their use in human medicine. Trends Biotechnol. 2008;26(8):425–433. | ||
Yoo D, Lee JH, Shin TH, Cheon J. Theranostic magnetic nanoparticles. Acc Chem Res. 2011;44(10):863–874. | ||
Ferrari M. Cancer nanotechnology: opportunities and challenges. Nat Rev Cancer. 2005;5(3):161–171. | ||
Dobrovolskaia MA, Aggarwal P, Hall JB, McNeil SE. Preclinical studies to understand nanoparticle interaction with the immune system and its potential effects on nanoparticle biodistribution. Mol Pharm. 2008;5(4):487–495. | ||
Fischer HC, Chan WC. Nanotoxicity: the growing need for in vivo study. Curr Opin Biotechnol. 2007;18(6):565–571. | ||
Dell’Orco D, Lundqvist M, Oslakovic C, Cedervall T, Linse S. Modeling the time evolution of the nanoparticle-protein corona in a body fluid. PLoS One. 2010;5(6):e10949. | ||
Casals E, Pfaller T, Duschl A, Oostingh GJ, Puntes V. Time evolution of the nanoparticle protein corona. ACS Nano. 2010;4(7):3623–3632. | ||
Capriotti AL, Cavaliere C, Foglia P, et al. Development of an analytical strategy for the identification of potential bioactive peptides generated by in vitro tryptic digestion of fish muscle proteins. Anal Bioanal Chem. 2014;77(11–12):755–769. | ||
Cedervall T, Lynch I, Foy M, et al. Detailed identification of plasma proteins adsorbed on copolymer nanoparticles. Angew Chem Int Ed Engl. 2007;46(30):5754–5756. | ||
Lundqvist M, Stigler J, Cedervall T, et al. The evolution of the protein corona around nanoparticles: a test study. ACS Nano. 2011;5(9):7503–7509. | ||
Capriotti AL, Caracciolo G, Cavaliere C, et al. Do plasma proteins distinguish between liposomes of varying charge density? J Proteomics. 2012;75(6):1924–1932. | ||
Nel AE, Madler L, Velegol D, et al. Understanding biophysicochemical interactions at the nano-bio interface. Nat Mater. 2009;8(7):543–557. | ||
Mahmoudi M, Lynch I, Ejtehadi MR, Monopoli MP, Bombelli FB, Laurent S. Protein-nanoparticle interactions: opportunities and challenges. Chem Rev. 2011;111(9):5610–5637. | ||
Lundqvist M, Stigler J, Elia G, Lynch I, Cedervall T, Dawson KA. Nanoparticle size and surface properties determine the protein corona with possible implications for biological impacts. Proc Natl Acad Sci U S A. 2008;105(38):14265–14270. | ||
Tenzer S, Docter D, Rosfa S, et al. Nanoparticle size is a critical physicochemical determinant of the human blood plasma corona: a comprehensive quantitative proteomic analysis. ACS Nano. 2011;5(9):7155–7167. | ||
Lundqvist M, Sethson I, Jonsson BH. Protein adsorption onto silica nanoparticles: conformational changes depend on the particles’ curvature and the protein stability. Langmuir. 2004;20(24):10639–10647. | ||
Lind K, Kresse M, Muller RH. Comparison of protein adsorption patterns onto differently charged hydrophilic superparamagnetic iron oxide particles obtained in vitro and ex vivo. Electrophoresis. 2001;22(16):3514–3521. | ||
Monopoli MP, Aberg C, Salvati A, Dawson KA. Biomolecular coronas provide the biological identity of nanosized materials. Nat Nanotechnol. 2012;7(12):779–786. | ||
Aggarwal P, Hall JB, McLeland CB, Dobrovolskaia MA, McNeil SE. Nanoparticle interaction with plasma proteins as it relates to particle biodistribution, biocompatibility and therapeutic efficacy. Adv Drug Deliv Rev. 2009;61(6):428–437. | ||
Ivanov YD, Govorun VM, Bykov VA, Archakov AI. Nanotechnologies in proteomics. Proteomics. 2006;6(5):1399–1414. | ||
Johnson CJ, Zhukovsky N, Cass AE, Nagy JM. Proteomics, nanotechnology and molecular diagnostics. Proteomics. 2008;8(4):715–730. | ||
Ray S, Chandra H, Srivastava S. Nanotechniques in proteomics: current status, promises and challenges. Biosens Bioelectron. 2010;25(11):2389–2401. | ||
Anderson NL, Anderson NG. The human plasma proteome: history, character, and diagnostic prospects. Mol Cell Proteomics. 2002;1(11):845–867. | ||
Qian WJ, Jacobs JM, Liu T, Camp DG 2nd, Smith RD. Advances and challenges in liquid chromatography-mass spectrometry-based proteomics profiling for clinical applications. Mol Cell Proteomics. 2006;5(10):1727–1744. | ||
Ray S, Reddy PJ, Choudhary S, Raghu D, Srivastava S. Emerging nanoproteomics approaches for disease biomarker detection: a current perspective. J Proteomics. 2011;74(12):2660–2681. | ||
Luchini A, Fredolini C, Espina BH, et al. Nanoparticle technology: addressing the fundamental roadblocks to protein biomarker discovery. Curr Mol Med. 2010;10(2):133–141. | ||
Godin B, Sakamoto JH, Serda RE, Grattoni A, Bouamrani A, Ferrari M. Emerging applications of nanomedicine for the diagnosis and treatment of cardiovascular diseases. Trends Pharmacol Sci. 2010;31(5):199–205. | ||
Capriotti AL, Caruso G, Cavaliere C, Piovesana S, Samperi R, Lagana A. Comparison of three different enrichment strategies for serum low molecular weight protein identification using shotgun proteomics approach. Anal Chim Acta. 2012;740:58–65. | ||
Fredolini C, Meani F, Luchini A, et al. Investigation of the ovarian and prostate cancer peptidome for candidate early detection markers using a novel nanoparticle biomarker capture technology. AAPS J. 2010;12(4):504–518. | ||
Villanueva J, Philip J, Entenberg D, et al. Serum peptide profiling by magnetic particle-assisted, automated sample processing and MALDI-TOF mass spectrometry. Anal Chem. 2004;76(6):1560–1570. | ||
Xi L, Junjian Z, Yumin L, Yunwen L, Hongbin W. Serum biomarkers of vascular cognitive impairment evaluated by bead-based proteomic technology. Neurosci Lett. 2009;463(1):6–11. | ||
Pasini EM, Mann M, Thomas AW. Red blood cell proteomics. Transfus Clin Biol. 2010;17(3):151–164. | ||
Goodman SR, Kurdia A, Ammann L, Kakhniashvili D, Daescu O. The human red blood cell proteome and interactome. Exp Biol Med. 2007;232(11):1391–1408. | ||
Weatherall DJ, Provan AB. Red cells I: inherited anaemias. Lancet. 2000;355(9210):1169–1175. | ||
Provan D, Weatherall D. Red cells II: acquired anaemias and polycythaemia. Lancet. 2000;355(9211):1260–1268. | ||
Ringrose JH, van Solinge WW, Mohammed S, et al. Highly efficient depletion strategy for the two most abundant erythrocyte soluble proteins improves proteome coverage dramatically. J Proteome Res. 2008;7(7):3060–3063. | ||
Roux-Dalvai F, Gonzalez de Peredo A, Simo C, et al. Extensive analysis of the cytoplasmic proteome of human erythrocytes using the peptide ligand library technology and advanced mass spectrometry. Mol Cell Proteomics. 2008;7(11):2254–2269. | ||
Wang M, You J, Bemis KG, Tegeler TJ, Brown DP. Label-free mass spectrometry-based protein quantification technologies in proteomic analysis. Brief Funct Genomics Proteomic. 2008;7(5):329–339. | ||
Suzuki R, Shimodaira H. Pvclust: an R package for assessing the uncertainty in hierarchical clustering. Bioinformatics. 2006;22(12):1540–1542. | ||
Bouyssie D, Gonzalez de Peredo A, Mouton E, et al. Mascot file parsing and quantification (MFPaQ), a new software to parse, validate, and quantify proteomics data generated by ICAT and SILAC mass spectrometric analyses: application to the proteomics study of membrane proteins from primary human endothelial cells. Mol Cell Proteomics. 2007;6(9):1621–1637. | ||
Mouton-Barbosa E, Roux-Dalvai F, Bouyssie D, et al. In-depth exploration of cerebrospinal fluid by combining peptide ligand library treatment and label-free protein quantification. Mol Cell Proteomics. 2010;9(5):1006–1021. | ||
Jimenez-Marin A, Collado-Romero M, Ramirez-Boo M, Arce C, Garrido JJ. Biological pathway analysis by ArrayUnlock and ingenuity pathway analysis. BMC Proc. 2009;3(suppl 4):S6. | ||
Kalfa TA, Pushkaran S, Mohandas N, et al. Rac GTPases regulate the morphology and deformability of the erythrocyte cytoskeleton. Blood. 2006;108(12):3637–3645. | ||
Wang L, Yang L, Filippi MD, Williams DA, Zheng Y. Genetic deletion of Cdc42GAP reveals a role of Cdc42 in erythropoiesis and hematopoietic stem/progenitor cell survival, adhesion, and engraftment. Blood. 2006;107(1):98–105. | ||
Shi M, Zabetian CP, Hancock AM, et al. Significance and confounders of peripheral DJ-1 and alpha-synuclein in Parkinson’s disease. Neurosci Lett. 2010;480(1):78–82. | ||
Bonifati V, Rizzu P, van Baren MJ, et al. Mutations in the DJ-1 gene associated with autosomal recessive early-onset parkinsonism. Science. 2003;299(5604):256–259. | ||
Spillantini MG, Crowther RA, Jakes R, Hasegawa M, Goedert M. alpha-Synuclein in filamentous inclusions of Lewy bodies from Parkinson’s disease and dementia with lewy bodies. Proc Natl Acad Sci U S A. 1998;95(11):6469–6473. | ||
Prohaska R, Sibon OC, Rudnicki DD, et al. Brain, blood, and iron: perspectives on the roles of erythrocytes and iron in neurodegeneration. Neurobiol Dis. 2012;46(3):607–624. | ||
Abraham S, Soundararajan CC, Vivekanandhan S, Behari M. Erythrocyte antioxidant enzymes in Parkinson’s disease. Indian J Med Res. 2005;121(2):111–115. | ||
Villanueva J, Lawlor K, Toledo-Crow R, Tempst P. Automated serum peptide profiling. Nat Protoc. 2006;1(2):880–891. |
 © 2015 The Author(s). This work is published and licensed by Dove Medical Press Limited. The full terms of this license are available at https://www.dovepress.com/terms.php and incorporate the Creative Commons Attribution - Non Commercial (unported, v3.0) License.
By accessing the work you hereby accept the Terms. Non-commercial uses of the work are permitted without any further permission from Dove Medical Press Limited, provided the work is properly attributed. For permission for commercial use of this work, please see paragraphs 4.2 and 5 of our Terms.
© 2015 The Author(s). This work is published and licensed by Dove Medical Press Limited. The full terms of this license are available at https://www.dovepress.com/terms.php and incorporate the Creative Commons Attribution - Non Commercial (unported, v3.0) License.
By accessing the work you hereby accept the Terms. Non-commercial uses of the work are permitted without any further permission from Dove Medical Press Limited, provided the work is properly attributed. For permission for commercial use of this work, please see paragraphs 4.2 and 5 of our Terms.