")
Back to Journals » OncoTargets and Therapy » Volume 7
A simple in vitro method for evaluating dendritic cell-based vaccinations
Authors Pham PV , Nguyen N, Nguyen H, Khuat L, Le P, Pham VQ, Nguyen ST, Phan N
Received 30 April 2014
Accepted for publication 9 June 2014
Published 18 August 2014 Volume 2014:7 Pages 1455—1464
DOI https://doi.org/10.2147/OTT.S67057
Checked for plagiarism Yes
Review by Single anonymous peer review
Peer reviewer comments 5
Phuc Van Pham, Nhung Thi Nguyen, Hoang Minh Nguyen, Lam Tan Khuat, Phong Minh Le, Viet Quoc Pham, Sinh Truong Nguyen, Ngoc Kim Phan
Laboratory of Stem Cell Research and Application, University of Science, Vietnam National University, Ho Chi Minh City, Vietnam
Background: Dendritic cell (DC) therapy is a promising therapy for cancer-targeting treatments. Recently, DCs have been used for treatment of some cancers. We aimed to develop an in vitro assay to evaluate DC therapy in cancer treatment using a breast cancer model.
Methods: DCs were induced from murine bone marrow mononuclear cells in Roswell Park Memorial Institute (RPMI) 1640 medium supplemented with GM-CSF (20 ng/mL) and IL-4 (20 ng/mL). Immature DCs were primed with breast cancer stem cell (BCSC)-derived antigens. BCSCs were sorted from 4T1 cell lines based on aldehyde dehydrogenase expression. A mixture of DCs and cytotoxic T lymphocytes (CTLs) were used to evaluate the inhibitory effect of antigen-primed DCs on BCSCs. BCSC proliferation and doubling time were recorded based on impedance-based cell analysis using the xCELLigence system. The specification of inhibitory effects of DCs and CTLs was also evaluated using the same system.
Results: The results showed that impedance-based analysis of BCSCs reflected cytotoxicity and inhibitory effects of DCs and CTLs at 72 hours. Differences in ratios of DC:CTL changed the cytotoxicity of DCs and CTLs.
Conclusion: This study successfully used impedance-based cell analysis as a new in vitro assay to evaluate DC efficacy in cancer immunotherapy. We hope this technique will contribute to the development and improvement of immunotherapies in the near future.
Keywords: CTLs, cytotoxicity assay, dendritic cells, immunotherapy, targeting therapy
Introduction
Dendritic cell (DC) vaccination is considered a promising strategy for cancer treatment and prevention, and, to date, DC immunotherapy is used clinically for various kinds of cancer, including newly diagnosed or recurrent high-grade glioma,1 advanced pancreatic carcinoma,2 metastatic colorectal cancer,3 cervical cancer II,4 renal cell carcinoma, and breast cancer.5 In combination with cytokine-induced killer cells, DCs have also been used successfully for gastric and colorectal cancer6 and localized and locally advanced renal cell carcinoma.7 Recent studies4–6 have attempted to improve the efficiency of DC vaccination by enhancing antigen presentation by DCs. To evaluate and compare the efficiency and specification of DC therapy, a simple, exact, and efficient method is essential. To date, few methods for the in vitro evaluation of DC vaccination efficacy have been described. Most studies have used a cytotoxic T lymphocyte (CTL) technique for DC evaluation. Currently, the chromium (51Cr) release assay is the gold standard for quantifying cytolytic activities of CTLs against target cells, and this method is still being used in many laboratories worldwide.8,9
However, the 51Cr assay has some limitations, especially in the use of radioactive materials that are inconvenient to handle. Therefore, it is important to develop nonradioactive methods to replace the 51Cr assay. To evaluate the effects of CTLs on target cells, previous studies8–12 labeled the target cells or effector cells with fluorescent dyes. The cytotoxicity value was recorded as the dead cell population appearing after incubation with CTLs.10 Other studies transduced target cells with a gene encoding green fluorescent protein11,12 or a combination of GFP and luciferase.8 Another method is based on the expression of caspase 3 in target cells after contact with CTLs, wherein CTL-mediated cytotoxicity is determined by flow cytometry to evaluate the caspase 3 positive population.13,14 An assay established by Nakagawa et al in 2011 detected the specific activity of CTLs by a reduction in sensitive target cell numbers using single-color histogram plot analysis and flow cytometry.15 In the first step, adherent cells (target cells) were incubated with effector CTLs, then the adherent cells were removed by trypsin/ethylenediaminetetraacetic acid (EDTA). The number of target cells was determined compared with controls (fluorescent calibration beads). From these studies, the cytotoxicity of CTLs was calculated.15 Although most of these assays have some advantages, such as simplicity, and have a sensitivity similar or higher to 51Cr,10,12–15 they also have some limitations, especially when the effect of CTLs on target cells is non-continuously recorded and monitored in real time. Furthermore, the methods based on flow cytometry require sufficient numbers of target cells for evaluation.
The aim of this study was to develop a new method by which to monitor and continuously record the effects of DCs via CTLs on target cells (breast cancer stem cells [BCSCs]) in real time. This method evaluated the cytotoxicity and proliferation of target cells based on changes of cell impedance using the xCELLigence system when target cells were treated with CTLs induced by antigen-primed DCs. This study used murine DCs and CTLs with the BCSC-derived 4T1 cell line.
Materials and methods
BCSC isolation and preparation of antigens
BCSCs were isolated from the 4T1 cell line based on aldehyde dehydrogenase (ALDH) expression. Briefly, 4T1 cells were stained by the ALDH kit (ALDEFLUOR™ kit; STEMCELL Technologies, Vancouver, British Columbia, Canada) according to the manufacturer’s guidelines (STEMCELL Technologies). All cells were analyzed on a FACsJazz™ cell sorter (BD Biosciences, San Jose, CA, USA). ALDH+ cells were gated based on a control signal. ALDH+ cells were sorted and proliferated in serum-free medium (MammoCult™; STEMCELL Technologies) to reduce spontaneous differentiation. The ALDH+ cells were considered BCSCs, as described in previously published studies.16–19 These cells were used to produce antigens.
Antigens were produced using the following protocol. Necrosis was induced in 106 BCSCs in 1 mL of phosphate-buffered saline (PBS) with a protease inhibitor cocktail by rapid freeze-thawing in nitrogen liquid (freezing for 3 minutes, warming for 3 minutes, repeated five times). The cells were centrifuged at 600× g for 5 minutes to collect proteins in the supernatant. These supernatant solutions were frozen at −80°C until use.
Isolation of mononuclear cells from murine bone marrow and induction to DCs
Mice were euthanized and bone marrow was collected according to the Guidelines of Laboratory Animal Manipulation, approved by the Institutional Animal Care and Use Committee of Stem Cell Research and Application Laboratory, University of Science, Vietnam National University, Ho Chi Minh City, Vietnam. The femurs of mice were dislodged and submerged in PBS supplemented with 1× antibiotic-mycotic (Sigma-Aldrich Co, St Louis, MO, USA). Bone marrow cells were used to isolate mononuclear cells by centrifuging in a Ficoll gradient (GE Healthcare Bio-Sciences Corp., Piscataway, NJ, USA). All cells obtained were maintained at 37°C with 5% CO2.
The differentiation protocol, which used GM-CSF and IL-4 in the culture medium, was modified from Schreurs et al.20 In the present study, we supplemented culture medium with IL-4 and observed that DCs cultured in GM-CSF plus IL-4 were potent stimulators of mixed leukocyte reactions. Culture medium used for all experiments was Roswell Park Memorial Institute (RPMI) 1640 (Sigma-Aldrich Co) supplemented with 2 mM/L L-glutamine, 100 μg/mL penicillin, 100 μg/mL streptomycin, and 10% heat-inactivated fetal bovine serum (Sigma-Aldrich Co). To produce immature DCs (iDCs), adherent cells were cultured for 6 days in medium containing recombinant GM-CSF and IL-4 at a concentration of 20 ng/mL each. At days 7–12, the cells were matured in complete media supplemented with antigens: 106 iDCs were incubated with 1 mL antigens from 106 BCSCs. The control group was supplemented with TNF-α at 20 ng/mL. At day 12, mature DCs (mDCs) were confirmed by flow cytometry detection of CD14 (for monocytes), CD40, CD80, and CD86 (for DCs). All monoclonal antibodies were bought from BD Biosciences.
Fluorescein isothiocyanate (FITC)–dextran uptake assay
The phagocytic capacity was analyzed as previously described.21 Briefly, iDCs and mDCs were incubated with dextran conjugated with FITC (1 mg/mL; Sigma-Aldrich Co) in culture medium for 1 hour at 37°C, or at 4°C for the negative control. Then, these cells were washed with PBS supplemented with 1% BSA before being analyzed with a flow cytometer (FACSCalibur™; BD Biosciences). Those cells that were found positive for FITC (detected by Fluorescence detector 1) were considered as cells that had successfully engulfed dextran.
T lymphocyte proliferation assay
T lymphocyte proliferation stimulated by DCs was evaluated as previously described.21 There were five experimental groups with different ratios of DCs:lymphocytes (0.25:100, 0.5:100, 1:100, 2:100, and 8:100) and three control groups with DCs + phytohemagglutinin (PHA), PHA alone, or PHA + lymphocytes. The T lymphocyte concentration was measured by 3-(4,5-dimethylthiazol-2-yl)-2,5-diphenyltetrazolium bromide (MTT) assay kit according to the manufacturer’s instructions (Sigma-Aldrich Co). Optical density values were read at a wavelength of 490 nm with the reference wavelength of 620 nm. The stimulation ability of DCs was calculated based on A-values. A-values were offset from optical density values measured for control samples (lymphocyte + PHA) and experimental groups.
Measurement of cytokines/chemokines
Measurement of IL-12 was performed per a previously published study.21 Briefly, mDCs were incubated in the fresh culture medium in a 24-well plate for 24 hours. Then, supernatants were collected and frozen at −80°C until analysis. IL-12 concentration in the supernatants was measured by enzyme-linked immunosorbent assay kits (IL-12 [Interleukin-12] High Sensitivity Human ELISA Kit; Abcam, Cambridge, UK), and the results were analyzed with the DTX880 Multimode Detector (Beckman Coulter, Inc., Brea, CA, USA).
In vitro evaluation of DC-based vaccination
To evaluate the effects of DCs on BCSCs, we developed a system using xCELLigence Real Time Cell Analyzer equipment. xCELLigence Real Time Cell Analyzer was used to evaluate cell proliferation and cytotoxicity based on changes in electric impedance at the surface of the E-plate, a specific plate with electric nodes on the surface allowing measurement of changes in impedance. This method was only used to evaluate cell proliferation and cytotoxicity for adherent cells. We observed differences in adherence of BCSCs, DCs, and CTLs. BCSCs were strongly attached to the surface of the E-plate, while DCs and lymphocytes had a weak attachment. Thus, based on the BCSC proliferation on the E-plate with or without DCs or CTLs, we could determine the cytotoxic effects of this therapy on target cells.
iDCs were incubated with BCSC-derived antigens for 24 hours with a ratio of DCs:necrotic BCSCs of 1:2. Then, mature primed DCs were collected and incubated with CTLs for 24 hours; DC:T-cell ratios were 1:10, 1:20, and 1:40. The mixture of primed DCs and CTLs was incubated for 24 hours. Finally, the mixture containing primed DCs and induced CTLs was added to the E-plate containing BCSCs that had adhered to the E-plate. The E-plates were then placed on the xCELLigence instrument to monitor BCSC proliferation. The effects of primed DCs and induced CTLs were based on the proliferation of BCSCs between different groups. There were seven groups in total (G0–G6), comprising experimental and control groups (Figure S1 and table S1).
Statistical analysis
All assays were performed in triplicate. Data are presented as the mean ± standard error of the mean. Data were processed by Prism software (v 6.0; GraphPad Software, Inc., La Jolla, CA, USA). A value of P<0.05 was considered statistically significant.
Results
Induced mononuclear cells express a DC phenotype
In inducing medium with cytokines GM-CSF and IL-4, most mononuclear cells changed their morphology. Under the microscope, these cells had expanded cytoplasm and had formed dendrites. When they were continuously induced to mature with inducing medium plus TNF-α or BCSC-derived antigens, they clearly exhibited the DC morphology with a large heterogeneity of nuclei, many mitochondria, and vacuoles (Figure 1). Results of DC marker analysis are presented in Figure 2. The results showed that mononuclear cells exhibited CD14+CD40−CD80−CD86− phenotype before induction. After induction, iDCs are characterized as CD86−CD40−CD14−CD80− and mDCs as CD40+CD80+CD86+CD14−.
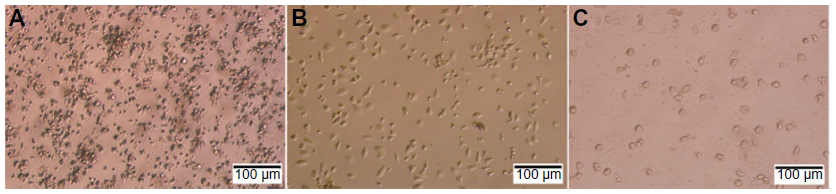 | Figure 1 Shape of cells during differentiation process to dendritic cells. |
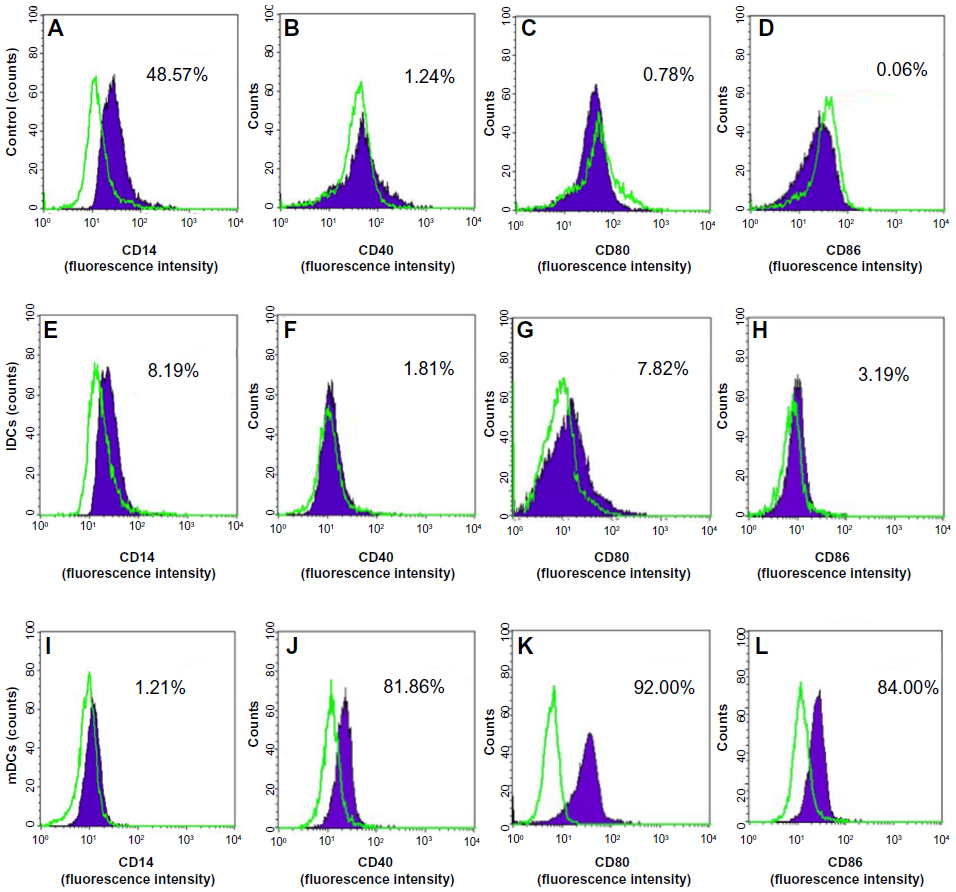 | Figure 2 DC marker analysis by flow cytometry. |
Phagocytosis
Phagocytosis is an important function of DCs, especially iDCs. Phagocytosis helps iDCs to uptake foreign proteins and then processes these proteins to present them to other immune cells. The results presented in Figure 3 showed that 92.28%±9.25% iDCs could engulf FITC–dextran, while only 78.54%±8.15% mDCs engulfed FITC–dextran. These cells could not engulf FITC–dextran when they were incubated at 0°C.
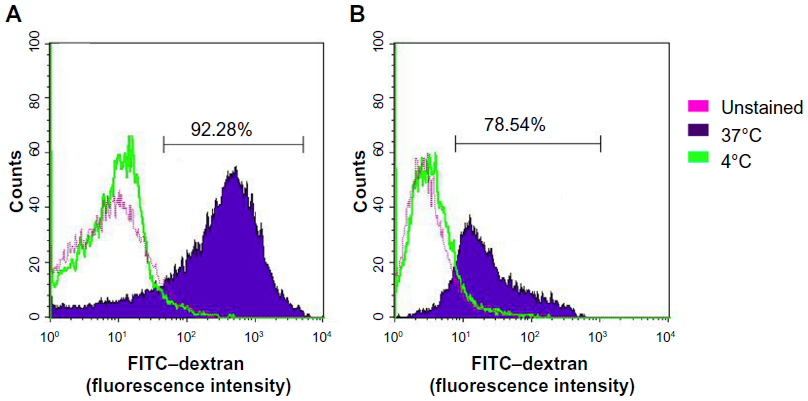 | Figure 3 Percentage of induced cells that engulfed FITC–dextran. |
Induced cells stimulated T lymphocytes
The stimulation ability of DCs was calculated based on A-values. A-values are smaller if the growth capacity of experimental cells is higher. Per the results presented in Figure 4, both DCs matured by TNF-α and BCSC-derived antigens stimulated T lymphocyte proliferation in the manner that depended on the mixing ratio of DCs and T lymphocytes. In comparison to the negative control, T-cell proliferation was augmented when the DC concentration increased (P<0.05). In fact, as the amounts of DCs increased, the A-values decreased. At the ratio of 0.25 DCs and 100 T lymphocytes, DCs nonsignificantly stimulated T lymphocytes compared to the negative control (0 DCs). The A-value at a mixing ratio of 0.5 DCs and 100 T lymphocytes was clearly different with control. However, the BCSC-derived antigen-primed DCs stimulated T lymphocytes less than the TNF-α-treated DCs did.
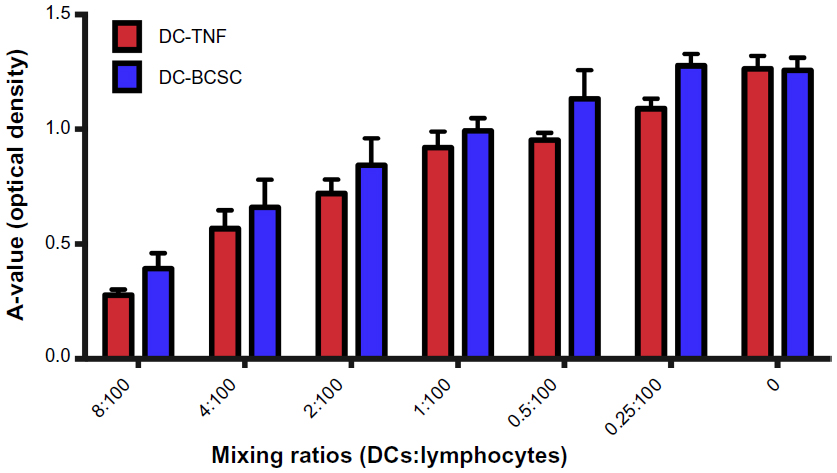 | Figure 4 Stimulation of lymphocyte proliferation by DCs. |
Induced cells produced IL-12
Typically, when DCs are activated by uptake of antigens, they produce IL-12, which signals CD4+ T-cell differentiation to a T helper (Th)1 phenotype that attacks cells containing antigens presented by the DCs. The results showed that, after being induced to mature by TNF-α or BCSC-derived antigens, mDCs produced IL-12 at a high level. IL-12 concentrations in the supernatants showed a statistically significant difference between mononuclear cells with and without cytokine treatment (P<0.5) (0 versus 120.0±26.46, 1,967±251.7, 2.733±251.7 pg/mL in mononuclear cells, iDCs, mDC-TNF-α, and mDC-BCSC, respectively) (Figure 5).
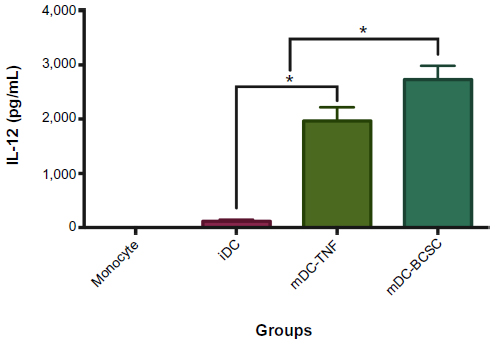 | Figure 5 IL-12 concentration was increased in DCs. |
BCSC proliferation was affected by DCs and induced T-cells
Changes in BCSC proliferating rates in different groups (from G1–G6) demonstrated an effect of antigen-primed DCs and induced T-cells on BCSCs. From 0–24 hours, proliferation of BCSCs in G1, G4, G5, and G6 was similar (Figure 6). The slope values of BCSC proliferation rates and their doubling times were also similar (Figure 7). Mature primed DCs and induced T-cells weakly adhered to the surface of the E-plate and the cell index value (CI value) slightly increased after 24 hours. However, these CI values were stable over 24–96 hours. After 12 hours of treatment with antigen-primed DCs and induced T-cells at different DC:T-cell ratios, in G4, G5, and G6 the BCSC proliferation rates gradually decreased, while BCSC proliferation in G1 gradually increased (Figure 6). The slope value of the BCSC proliferation rate in G1 was nearly double these values in G4, G5, and G6, while the doubling time was reduced by one-half compared to in G4, G5, and G6. From 48–72 hours, BCSCs in G6 completely inhibited so that slope value was negative, while BCSCs in G4 and G5 still slightly proliferated and significantly different to G1 (Figure 7). From 72–96 hours, BCSCs in all groups significantly decreased because of a lack of nutrients in the medium (Figure 7). The lowest slope value was recorded in G6, and was significantly different to those of G4 and G5. The slope values of G4 and G5 were significantly different with each other (Figure 7).
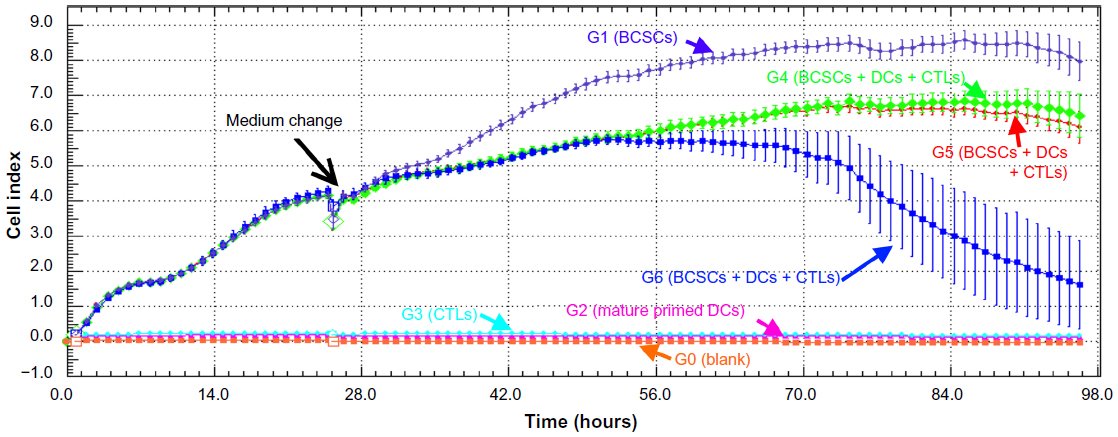 | Figure 6 BCSC proliferation in different groups recorded by the xCELLigence system. |
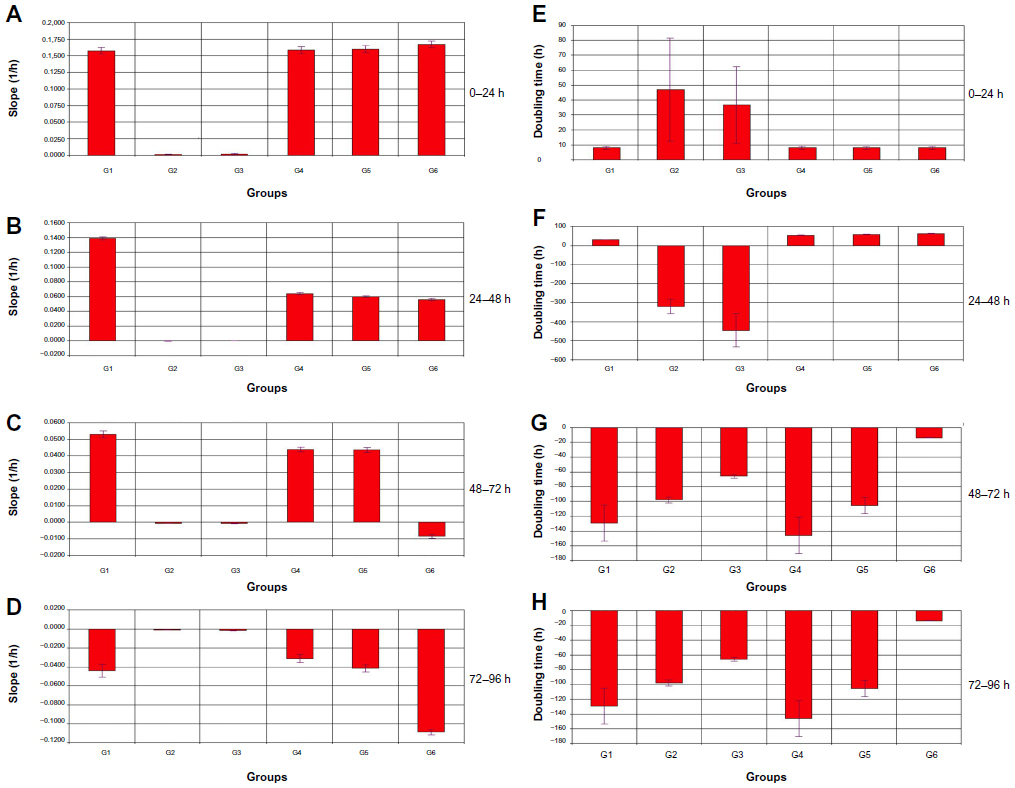 | Figure 7 Slope values of BCSC proliferation rates and doubling times of BCSCs. |
Discussion
DCs are professional antigen-presenting cells. Unlike macrophages, they present antigens to T-cells, B-cells, and natural killer (NK) cells. Therefore, DCs are a powerful tool for immunotherapy of cancer. However, the clinical efficiency of DC vaccination therapy might be improved, especially regarding the types of antigens that are used to prime DCs and the use of combinations of subtypes of DCs. This study established a simple in vitro assay to evaluate the efficiency of DC vaccination in real time. To set up this assay, we used murine DCs induced from bone marrow mononuclear cells, allogenic T-cells derived from murine peripheral blood, and 4T1 cell line-derived BCSCs. The xCELLigence system was used to record the BCSC proliferation in real time. This system will record any changes in the electrode impedance that depends on the number of cells in wells, which means that the more cells that are attached on the electrodes, the larger the increases in electrode impedance. As such, the xCELLigence system allows for robust assessment of cellular behavior in real time. More importantly, this technology is label-free and real-time, and offers several advantages, such as accurate determination of response kinetics, the ability to use native receptors, and the opportunity to capture biological responses involving multiple second messenger pathways.
DCs were successfully induced from bone marrow-derived mononuclear cells. These cells were demonstrated to be functional DCs that could perform activities of antigen-presenting cells. This first function of antigen-presenting cells was phagocytosis. DCs, especially iDCs, could strongly phagocytize FITC–dextran. The results showed that, after incubation with dextran, there was a 92.28%±9.25% uptake in iDCs. DCs could stimulate the CD4+ T-cells in a dose-dependent manner. In fact, the results showed that, after being induced to mature, DCs expressed two co-receptors, including CD80 and CD86, to activate memory T- and naïve T-cells.22–24 Besides these direct interactions between DCs and T-cells, these DCs also could indirectly interact with T-cells over long distances via IL-12. In the present study IL-12 is important in naïve T-cell activation, and induced differentiation of naïve T-cells into Th0 then to Th1 or Th2. In vivo, IL-12 is produced by DCs, macrophages, and B-cells.25,26
DCs produced by this procedure were used to evaluate the assay. CD8+ T-cells were sorted from murine peripheral blood and used as effector CTLs. The results showed that, based on impedance changes of adherent target cells in the E-plate, we could record the effects of primed DCs and induced T-cells on BCSCs in real time. Antigen-primed DCs induced CTLs in vitro. These signals helped CTLs attack BCSCs. Because antigen presentation efficiency depends on the ratio of DCs to T-cells, we used three ratios of DCs to T-cells (1:10, 1:20, and 1:40). Induced CTLs clearly inhibited BCSC proliferation. In wells with primed DCs and induced CTLs, BCSC proliferation decreased after 12 hours, while controls incubated with medium without DCs or CTLs showed strong BCSC proliferation. Thus, primed DCs and induced CTLs efficiently suppressed proliferation or were toxic to BCSCs. To eliminate errors caused by DCs or CTLs adhering to the E-plate surface, we also showed that primed DCs and induced CTLs had no significant effect on impedance compared with non-cell wells. In a recent study, Guan et al17 showed that T-cell adhesion rapidly changed during T-cell activation. T-cells were activated 30 minutes after contact with Jurkat cells, and, after 6 hours, most cells were floating and CI values were significantly decreased.17 Therefore, a mixture of DCs and CTLs clearly affected BCSC growth.
Differences in ratio of DCs and CTLs also caused differences in BCSC proliferation. A ratio of 1:40 of DCs and CTLs showed the strongest inhibition of BCSCs, which was significantly different to that of ratios of 1:10 and 1:20, indicating the assay was sensitive for the evaluation of changes in impedance caused by the numbers or shapes of BCSCs. Because this system continuously records impedance, the doubling time of BCSCs could be determined. Doubling time values reflect the time required for a cell to undergo mitosis and form two cells. Doubling time was extended in inhibited cells compared with normal conditions. When ratios of 1:40 of DCs and CTLs were used, the doubling time was significantly extended and was longer than when ratios of 1:10 and 1:20 were used. The doubling time values at all three ratios were significantly longer than for controls.
Based on impedance values at different times, the system software also calculated the slope value for different groups. Slope values reflected the rate of increase or rate of decrease of proliferation. Slope values of groups in the same time frame were significantly different between controls and experimental groups with primed DCs and induced CTLs and between groups using a ratio of 1:40 of primed DCs and induced CTLs compared with groups of 1:10 and 1:20 ratios. These results confirmed that effects of primed DCs and induced CTLs on BCSC proliferation could be recorded and evaluated by this assay.
Effects of primed DCs and CTLs on target cells have been clearly shown in previous studies.8,12,15 To determine changes in target cells, particularly cytotoxicity, distinct methods based on the properties of target cells undergoing apoptosis have been used to measure products or amounts of target cells killed by CTLs.8,12,15 When target cells die, they release intracellular proteins such as granzyme B, CD107a, and caspase-3. Concentrations of these proteins in supernatants depend on the amount of dead target cells. In conventional assays, Cr51 is used to label target cells. When target cells are fragmented by CTLs, Cr51 is released into the supernatant and concentrations of Cr51 in the supernatant reflect the CTL cytotoxic activity.8,9 To develop simpler assays, flow cytometry-based methods were used. These assays used fluorescent dyes and/or were combined with markers for apoptotic cells to analyze the percentage of dead or apoptotic cells after incubation with CTLs. The greatest limitation of these methods was that changes in cellular physiology of target cells were only recorded at single time points and were reliant on particular protein expression or the release of intracellular components.
Changes in protein components, cell shape, or cell metabolism in target cells can be measured by changes in impedance. Impedance measurements have been used in a number of different studies to determine morphological changes in real time;27 cisplatin-induced cell death;28 differentiation of 3T3 cells into adipocytes;29 effects of curcumin on physicochemical characterization and effects on MCF7 cancer cell proliferation;30 monitoring of dynamic interactions of tumor cells with tissues and immune cells on a lab-on-a-chip;31 cell senescence measurements of adipose tissue-derived stem cells;32 and real-time evaluation of nanoparticle-induced cytotoxic effects.33 By this method, Moodley et al34 conducted real-time profiling of NK cell killing of human astrocytes. NK cells did not register any confidence interval value signal directly because of nonadherence, and therefore all changes in confidence interval values were a direct measure of astrocyte responses.34
Conclusion
In this study, an in vitro assay to evaluate DC therapy efficiency was developed. Antigen presentation of DCs to CTLs, and cytotoxic effects of CTLs on target cells, can be monitored in real time by impedance analysis based on E-plates and read by the xCELLigence system. This is a simple, efficient, and real-time assay that records changes in target cell proliferation, doubling time, and proliferating or inhibiting slopes. This assay is so sensitive that small differences in ratios of DCs and CTLs, as well as antigen source and target cells, can be recorded. Thus, impedance-based analysis is a powerful tool for DC- and CTL-based immunotherapy. However, this study did not compare this assay with traditional methods, such as Cr51 releasing or flow cytometry. We hope this technique will contribute to the development and improvement of immunotherapies in the near future.
Acknowledgment
This work was supported by the Vietnam National University, Ho Chi Minh City, Vietnam, under grant B2011-18-06TD.
Author contributions
PVP suggested the idea; wrote the manuscript; and performed assays for dendritic cell induction. NTN isolated and produced dendritic cells. HMN isolated and prepared breast cancer stem cells. PML and HMN did assays for dendritic cells. LTK and NKP performed assays for tumor specific response of dendritic cells and revised the manuscript. All authors contributed toward data analysis, drafting and revising the paper and agree to be accountable for all aspects of the work.
Disclosure
The authors report no conflicts of interest in this work.
References
Lasky JL 3rd, Panosyan EH, Plant A, et al. Autologous tumor lysate-pulsed dendritic cell immunotherapy for pediatric patients with newly diagnosed or recurrent high-grade gliomas. Anticancer Res. 2013;33(5):2047–2056. | |
Bauer C, Dauer M, Saraj S, et al. Dendritic cell-based vaccination of patients with advanced pancreatic carcinoma: results of a pilot study. Cancer Immunol Immunother. 2011;60(8):1097–1107. | |
Burgdorf SK. Dendritic cell vaccination of patients with metastatic colorectal cancer. Dan Med Bull. 2010;57(9):B4171. | |
Ferrara A, Nonn M, Sehr P, et al. Dendritic cell-based tumor vaccine for cervical cancer II: results of a clinical pilot study in 15 individual patients. J Cancer Res Clin Oncol. 2003;129(9):521–530. | |
Baek S, Kim CS, Kim SB, et al. Combination therapy of renal cell carcinoma or breast cancer patients with dendritic cell vaccine and IL-2: results from a phase I/II trial. J Transl Med. 2011;9:178. | |
Gao D, Li C, Xie X, et al. Autologous tumor lysate-pulsed dendritic cell immunotherapy with cytokine-induced killer cells improves survival in gastric and colorectal cancer patients. PloS One. 2014;9(4):e93886. | |
Zhan HL, Gao X, Pu XY, et al. A randomized controlled trial of postoperative tumor lysate-pulsed dendritic cells and cytokine-induced killer cells immunotherapy in patients with localized and locally advanced renal cell carcinoma. Chin Med J (Engl). 2012;125(21):3771–3777. | |
Fu X, Tao L, Rivera A, et al. A simple and sensitive method for measuring tumor-specific T cell cytotoxicity. PloS One. 2010;5(7):e11867. | |
Lemonnier FA. Evaluating CD8+ T cell responses in vitro. Methods Mol Biol. 2013;960:261–277. | |
Höppner M, Luhm J, Schlenke P, Koritke P, Frohn C. A flow-cytometry based cytotoxicity assay using stained effector cells in combination with native target cells. J Immunol Methods. 2002;267(2):157–163. | |
van Baalen CA, Gruters RA, Berkhoff EG, Osterhaus AD, Rimmelzwaan GF. FATT-CTL assay for detection of antigen-specific cell-mediated cytotoxicity. Cytometry A. 2008;73(11):1058–1065. | |
Chen K, Chen L, Zhao P, et al. FL-CTL assay: fluorolysometric determination of cell-mediated cytotoxicity using green fluorescent protein and red fluorescent protein expressing target cells. J Immunol Methods. 2005;300(1–2):100–114. | |
Jerome KR, Sloan DD, Aubert M. Measurement of CTL-induced cytotoxicity: the caspase 3 assay. Apoptosis. 2003;8(6):563–571. | |
He L, Hakimi J, Salha D, Miron I, Dunn P, Radvanyi L. A sensitive flow cytometry-based cytotoxic T-lymphocyte assay through detection of cleaved caspase 3 in target cells. J Immunol Methods. 2005;304(1–2):43–59. | |
Nakagawa Y, Watari E, Shimizu M, Takahashi H. One-step simple assay to determine antigen-specific cytotoxic activities by single-color flow cytometry. Biomed Res. 2011;32(2):159–166. | |
Kim RJ, Park JR, Roh KJ, et al. High aldehyde dehydrogenase activity enhances stem cell features in breast cancer cells by activating hypoxia-inducible factor-2α. Cancer Lett. 2013;333(1):18–31. | |
Guan N, Deng J, Li T, Xu X, Irelan JT, Wang MW. Label-free monitoring of T cell activation by the impedance-based xCELLigence system. Mol Biosyst. 2013;9(5):1035–1043. | |
Zhuang X, Zhang W, Chen Y, et al. Doxorubicin-enriched, ALDH(br) mouse breast cancer stem cells are treatable to oncolytic herpes simplex virus type 1. BMC Cancer. 2012;12:549. | |
Ginestier C, Hur MH, Charafe-Jauffret E, et al. ALDH1 is a marker of normal and malignant human mammary stem cells and a predictor of poor clinical outcome. Cell Stem Cell. 2007;1(5):555–567. | |
Schreurs MW, Eggert AA, de Boer AJ, Figdor CG, Adema GJ. Generation and functional characterization of mouse monocyte-derived dendritic cells. Eur J Immunol. 1999;29(9):2835–2841. | |
Phuc PV, Lam DH, Ngoc VB, Thu DT, Nguyet NT, Ngoc PK. Production of functional dendritic cells from menstrual blood – a new dendritic cell source for immune therapy. In Vitro Cell Dev Biol Anim. 2011;47(5–6):368–375. | |
van Rijt LS, Vos N, Willart M, et al. Essential role of dendritic cell CD80/CD86 costimulation in the induction, but not reactivation, of TH2 effector responses in a mouse model of asthma. J Allergy Clin Immunol. 2004;114(1):166–173. | |
Van Gool SW, Vandenberghe P, de Boer M, Ceuppens JL. CD80, CD86 and CD40 provide accessory signals in a multiple-step T-cell activation model. Immunol Rev. 1996;153:47–83. | |
Lanier LL, O’Fallon S, Somoza C, et al. CD80 (B7) and CD86 (B70) provide similar costimulatory signals for T cell proliferation, cytokine production, and generation of CTL. J Immunol. 1995;154(1):97–105. | |
Henry CJ, Ornelles DA, Mitchell LM, Brzoza-Lewis KL, Hiltbold EM. IL-12 produced by dendritic cells augments CD8+ T cell activation through the production of the chemokines CCL1 and CCL17. J Immunol. 2008;181(12):8576–8584. | |
Nizzoli G, Krietsch J, Weick A, et al. Human CD1c+ dendritic cells secrete high levels of IL-12 and potently prime cytotoxic T-cell responses. Blood. 2013;122(6):932–942. | |
Yu N, Atienza JM, Bernard J, et al. Real-time monitoring of morphological changes in living cells by electronic cell sensor arrays: an approach to study G protein-coupled receptors. Anal Chem. 2006; 78(1):35–43. | |
Alborzinia H, Can S, Holenya P, et al. Real-time monitoring of cisplatin-induced cell death. PloS One. 2011;6(5):e19714. | |
Kramer AH, Joos-Vandewalle J, Edkins AL, Frost CL, Prinsloo E. Real-time monitoring of 3T3-L1 preadipocyte differentiation using a commercially available electric cell-substrate impedance sensor system. Biochem Biophys Res Commun. 2014;443(4):1245–1250. | |
Hasan M, Belhaj N, Benachour H, et al. Liposome encapsulation of curcumin: physico-chemical characterizations and effects on MCF7 cancer cell proliferation. Int J Pharm. 2014;461(1–2):519–528. | |
Charwat V, Rothbauer M, Tedde SF, et al. Monitoring dynamic interactions of tumor cells with tissue and immune cells in a lab-on-a-chip. Anal Chem. 2013;85(23):11471–11478. | |
Jun HS, Dao LT, Pyun JC, Cho S. Effect of cell senescence on the impedance measurement of adipose tissue-derived stem cells. Enzyme Microb Technol. 2013;53(5):302–306. | |
Moe B, Gabos S, Li XF. Real-time cell-microelectronic sensing of nanoparticle-induced cytotoxic effects. Anal Chim Acta. 2013;789:83–90. | |
Moodley K, Angel CE, Glass M, Graham ES. Real-time profiling of NK cell killing of human astrocytes using xCELLigence technology. J Neurosci Methods. 2011;200(2):173–180. |
Supplementary materials
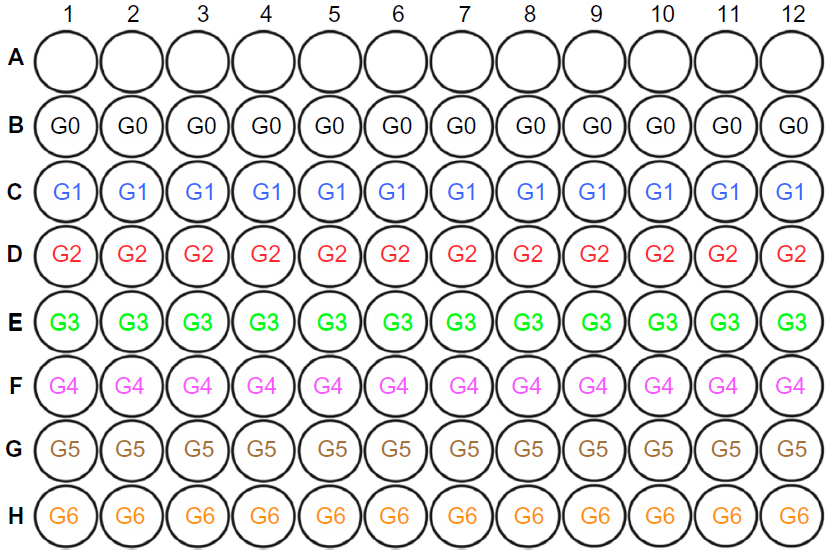 | Figure S1 Layout of experimental and control groups in E-plate. |
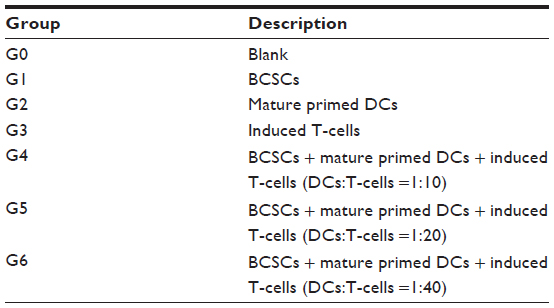 | Table S1 Experimental and control groups |
 © 2014 The Author(s). This work is published and licensed by Dove Medical Press Limited. The full terms of this license are available at https://www.dovepress.com/terms.php and incorporate the Creative Commons Attribution - Non Commercial (unported, v3.0) License.
By accessing the work you hereby accept the Terms. Non-commercial uses of the work are permitted without any further permission from Dove Medical Press Limited, provided the work is properly attributed. For permission for commercial use of this work, please see paragraphs 4.2 and 5 of our Terms.
© 2014 The Author(s). This work is published and licensed by Dove Medical Press Limited. The full terms of this license are available at https://www.dovepress.com/terms.php and incorporate the Creative Commons Attribution - Non Commercial (unported, v3.0) License.
By accessing the work you hereby accept the Terms. Non-commercial uses of the work are permitted without any further permission from Dove Medical Press Limited, provided the work is properly attributed. For permission for commercial use of this work, please see paragraphs 4.2 and 5 of our Terms.