")
Back to Journals » ClinicoEconomics and Outcomes Research » Volume 7
A potential gender bias in assessing quality of life – a standard gamble experiment among university students
Authors Al Obaidi L, Mahlich J
Received 5 March 2015
Accepted for publication 24 March 2015
Published 24 April 2015 Volume 2015:7 Pages 227—233
DOI https://doi.org/10.2147/CEOR.S84065
Checked for plagiarism Yes
Review by Single anonymous peer review
Peer reviewer comments 3
Editor who approved publication: Professor Giorgio L Colombo
Leath Al Obaidi,1 Jörg Mahlich2,3
1University of Nottingham, School of Economics, Nottingham, UK; 2Health Economics, Janssen KK, Tokyo, Japan; 3Düsseldorf Institute for Competition Economics (DICE), University of Düsseldorf, Düsseldorf, Germany
Background: There are several methodologies that can be used for evaluating patients' perception of their quality of life. Most commonly, utilities are directly elicited by means of either the time-trade-off or the standard-gamble method. In both methods, risk attitudes determine the quality of life values.
Methods: Quality of life values among 31 Austrian undergraduate students were elicited by means of the standard gamble approach. The impact of several variables such as gender, side job, length of study, and living arrangements on the quality of life were identified using different types of regression techniques (ordinary least squares, generalized linear model, Betafit).
Results: Significant evidence was found that females are associated with a higher quality of life in all specifications of our estimations.
Discussion: The observed gender differences in quality of life can be attributed to a higher degree of risk aversion of women. A higher risk aversion leads to a higher valuation of given health states and a potential gender bias in health economic evaluations. This result could have implications for health policy planners when it comes to budget allocation decisions.
Keywords: quality of life, gender, risk aversion, standard gamble, students
Background
In some countries such as the UK, health technology assessment agencies evaluate new medical interventions like new pharmaceuticals in the framework of a cost utility analysis. While the additional costs of a given new intervention can, on the whole, be easily measured in monetary units, the benefit of this intervention is much harder to evaluate. A cost utility analysis employs gained quality adjusted life years as a benefit measure. One additional life year is weighted by its “quality” expressed in so called utilities drawing on the work of von Neumann and Morgenstern who developed an axiom based decision theory under uncertainty.1 In clinical praxis there are different ways to elicit health related utilities. Most commonly, answers from standardized questionnaires such the EQ 5D from the EuroQol Group Association, or the short form 36 (SF36) are transformed into utilities by using empirically based algorithms.2–4 Alternatively, utilities can be directly elicited by means of either the standard-gamble (SG) or the time-trade-off method. The SG method is recommended for measurement of individuals’ preferences under uncertainty and to express the outcome of different therapeutic choices in utility values to be used in clinical decision analysis and health program evaluation.5 Based on normative expected-utility arguments, health researchers consider the SG method as the gold standard for utility measurement.6 As this method presents a decision problem in the framework of a risky lottery, it gives rise to a potential gender bias as men and women differ in their willingness to accept risks, with women being more risk averse than men. Rosen et al for instance found significant predictors of increasing risk aversion in multivariate modeling, namely white race (P<0.01), lower education (P<0.05), and female gender (P=0.07). Based on those findings we expect that females would report lower quality of life values when those values are elicited in the framework of an SG experiment.7 To test this hypothesis we conducted an SG experiment with economics students of the University of Vienna, Austria. We framed the experiment using study related stress as the background scenario. Stress and burn out symptoms among students are worldwide on the rise leading to an impairment of students’ quality of life.8–11 For instance, the Austrian Ministry for Science and Research commissioned a survey looking at the situation of Austrian students since the early 1970s. The latest report was released in 2012 by the Institute for Advanced Studies.12 One of the key findings was that currently 45% of the students suffer from mental health problems attributable to one of the following reasons: pressure to perform, fear of failure, fears of taking an exam, existential fear, feelings of depression, low self-esteem, pressure of competition, contact difficulties (social isolation). Moreover, the authors also discovered female students to be more prone to stress than their male counterparts, which was observed in many descriptive surveys.13 However, the cited studies have not employed a decision analytic framework to elicit stress related quality of life values. In the subsequent analysis we try to identify if gender influences the observed variance in the quality of life between students using an SG experiment setting.
Methods
Standard-gamble
We have operationalized the gamble as follows: the students were asked to choose between two alternatives A and B. Alternative A is to stay in the current state of health (with the current stress level) with certainty. Alternative B is a lottery with two outcomes. Outcome B1 is an absolutely stress free state of health that occurs with probability p while outcome B2 represents an intense stress level (“burnout scenario”) that occurs with probability 1–p. Outcome B2 is characterized by the following stress symptoms: fatigue, anorexia, insomnia, attentiveness disorder, self-reproaches, obliviousness, inability to make decisions, anxiety attacks, testiness, and listlessness.14 It was also mentioned that high stress levels have a negative impact on the cardiovascular system and subsequently on mortality;15 that stress is related to adverse lifestyle and diabetes,16 or leads to people adopting bad habits such as smoking or heavy drinking as a coping behavior.17
The students were asked to state probability p* that indicates indifference between the two alternatives A and B. We then used p* to interpret the utility level of the current state of health. The gamble is illustrated in Figure 1. We made use of a so called probability wheel as a visual aid to the respondents.
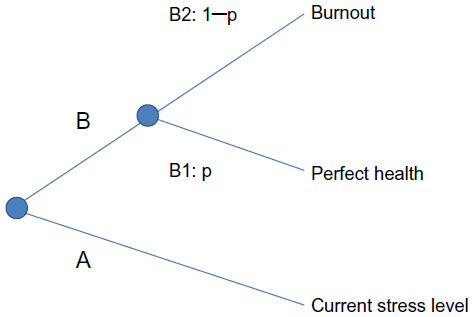 | Figure 1 Illustration of the gamble. |
Note that the worst outcome in this gamble is not death but a very severe degree of stress. To compare the utility values elicited from this gamble with other indications one would need to calibrate the results. However, for our purpose the absolute values are not important as we only want to understand influencing factors of the quality of life values.
Thirty-one undergraduate economics students of the University of Vienna participated in this SG experiment. They were recruited among attendees of the health economics class in summer term 2013 that was held by one of the authors. The gamble was conducted between May and August 2013. Informed consent was obtained from all participants.
Regression analysis
To identify factors that influence the observed quality of life we employed multivariate regression techniques to estimate the following equation:

with QoL as quality of life index and X being a vector of explanatory variables. Assuming a linear relationship we can specify:

In the base case scenario we used ordinary least squares (OLS). As the dependent variable QoL is an index limited between 0 and 1, some statisticians have proposed estimation methods other than OLS for this particular case.18 Papke and Wooldridge suggested a generalized linear model to accommodate for proportional data.19 Their approach makes use of the logit transformation of the response variable and the binomial distribution.20 Yet, Ferrari and Cribari-Neto came up with the Betafit regression.21 Their approach assumes that the proportion follows a beta distribution. The beta distribution is bounded between 0 and 1 and models heteroscedasticity in such a way that the variance is largest when the average proportion is near 0.5. The main advantage of beta regression over OLS regression is that it is more robust in estimating covariate effects.22
We estimated Equation 2 with all three methods using Stata 12 (StataCorp LP, College Station, TX, USA). We included the following explanatory variables that were believed to influence the stress level:
- Gender: in the Austrian student survey the researchers found female students to be more prone to stress than their male fellow students, which confirmed older results gathered from physicians23 or results from the Global Ageing Survey.24 Also recent large scale cardiovascular study also found that women had a significantly higher level of mental stress than men.25 The question is if higher stress levels are also reflected in lower utilities when elicited in an SG setting.
- Living with parents: as trouble with parents is a major cause of students’ stress level,26 we expected students who still live at home with their parents to suffer from more stress than those who live on their own.
- Part-time job to finance studies: more and more students are working during their studies, which might increase their stress level. On the other hand, a part-time job affects income which in turn positively influences quality of life at least up to a certain level,27,28 although some researchers even suggest an inverse relationship between income and quality of life.29
- Studying more than one subject: some students study not just one subject but sometimes two or more, as they believe that this will give them an edge in the labor market. It goes without saying that we expect a higher stress level to be associated with this strategy.
- Number of study semesters: we do not have a particular assumption in mind that relates to the length of the studies to the quality of life, but one might think of two conflicting effects: freshman face more stress because of the transitional nature of a new stage.30,31 On the other hand, the longer a student is at university, the more pressure they might be under from parents, not to mention the exam related stress they face which intensifies at the later stage of a student’s life.
- Expected number of semesters to graduation: this information is much related to the previous question. We expect that stress becomes stronger the closer a student is to their graduation.
Results
In Table 1 we show the headline statistics from our sample. From the 31 respondents (15 female and 16 male undergraduate economics students), all respondents had finished at least one semester at the university. The highest number of semesters studied by a participant was 12. About 35% of the students study a second degree. Fifty percent of the students work while they are studying. Eighty-seven percent of the respondents live on their own. In the last row of the table we present the quality of life values as assessed by the SG method. The value has a mean of 0.57 with a standard deviation of 0.25.
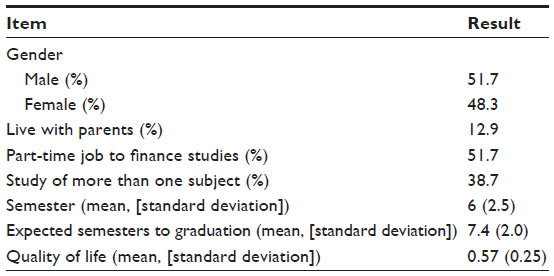 | Table 1 Student characteristics and quality of life values |
Subgroup analysis
We report some subgroup results for the quality of life values in Table 2: female students have a higher QoL value than their male classmates; people who live with their parents have a lower mean in QoL-value than people who live away from their parents. Students who do not work have a lower quality of life than their peers who do work.
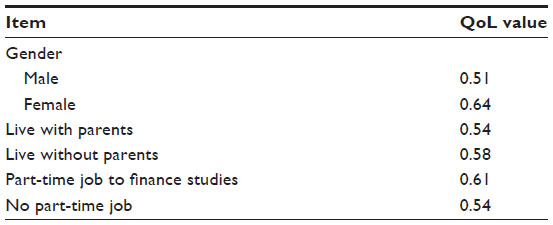 | Table 2 Subgroup results for quality of life values |
Regression analysis
We conducted the regression analysis to identify drivers of quality of life. The results are displayed in Table 3.
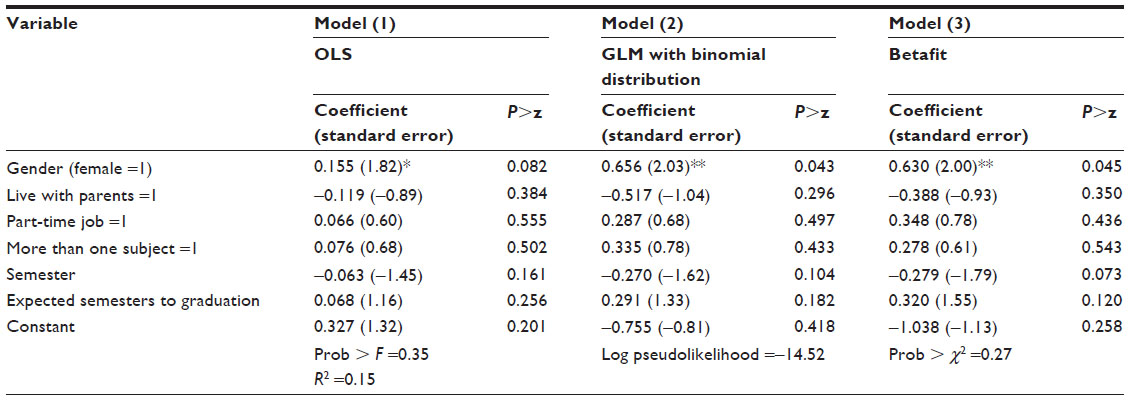 | Table 3 Determinants of quality of life |
Based on this analysis we believe that the quality of life values are positively related to the following explanatory variables: female gender, part-time job, studying more than one subject, and the expected time until graduation. Living with parents and the number of semesters studied assert a negative influence on the quality of life. The biggest positive impact on the quality of life is female gender. This variable is also significant in all specifications. The small sample size drives the low R2 value of 15% in model 1.
Discussion
In this work we introduce the SG method with an examination of students at the University of Vienna. We consider our most striking finding to be that quality of life values differ significantly between male and female students. This is in contrast to other studies conducted using different methods to assess quality of life or happiness, who did not find significant gender differences32 or even found females reporting higher stress and lower quality of life values.20 In our study, however, female students seem to value given health states more highly than men, which can probably be attributed to differences in their respective utility functions. Experimental economists confirm these findings and found that male gender, parental education, and height positively correlate with the willingness to take risks. Shorter individuals, older persons, and women on the other hand are less willing to take risks.33 Other researchers have come to the same conclusion with regard to female gender being a significant predictor of risk aversion.34–41 One explanation that was put forward is the potential overconfidence of men about their decisions, as men believe they can predict possible outcomes more accurately than women.42 In more familiar health economic terms, one could hypothesize that women are more subject to scale compatibility than men in that they focus more on the outcome that involves the bad-outcome probability in SGs.43
This finding gives rise to a potential gender bias in the assessment of quality of life. Risberg et al define a gender bias in medicine to be when one assumes sameness and/or equity between women and men when there are genuine differences to consider.44 Then, because in the SG method participants’ risk attitudes drive the utility assessment, a gender bias has a big impact in many ways. The risk attitude is directly related to the curvature of the von Neumann–Morgenstern utility functions: risk neutral individuals have linear utility functions, while risk seeking individuals have convex utility functions and risk adverse individuals have concave utility functions. If women are really more risk averse than men, their utility functions would be more concave and show diminishing marginal utilities, this has the following far reaching implications:
- As women have a preference for the status quo, they systematically value given state of health more than men.
- For interventions that lead to a restoration of the perfect health state (utility level 1), men always benefit more than women regardless of their initial state of health before treatment.
- For interventions that lead to a marginal improvement of a patient’s state of health, the marginal benefit is larger for women in states of health that are close to death (utility level 0). On the other hand, from a certain threshold health level men always benefit more from an incremental improvement.
The different shapes of the utility functions would also impact allocation decisions in health care. A social planner with a given budget, who wants to maximize the utility of the society, would discriminate between men and women. Depending on the nature of the disease and the intervention, in most cases he would allocate more of his budget to the treatment of men, this is because women enjoy already higher quality of life values and investing in women’s health care would result only in marginal utility gains. Our results therefore cast some doubt on the use of “unisex” tariffs in health economic evaluations of health states, when men and women have different quality of life interpretations of certain health dimensions.45 On the other side, some economists suggest that gender differences in risk aversion are not significant when it comes to decisions on pension plans46 and an Israeli study found female students even less risk averse than their male classmates.47 Further research should certainly explore this issue in more detail in the health care context.
Another confounder beside gender that drives risk aversion is cognitive ability. Although this was not part of our study, previous literature found individuals with higher cognitive ability are significantly more willing to take risks.48 If this argument is thought through, smarter people would benefit more from most medical interventions as well. Eventually, smart men would receive the highest share of the health care budget if allocation decisions were solely based on utility maximization. A recent study from Thailand indeed showed that male respondents with a high level of education have a higher willingness to pay for an increase of their quality of life.49
Risk aversion can also explain utility variation across countries. The Japanese utilities for instance are smaller than those of other countries for mild health states but, for worse states, above all other models.50 Compared to other countries, the Japanese society is one of the most uncertainty avoiding countries on earth as Dutch sociologist Geert Hofstede puts it.51 The observed utilities for Japanese therefore perfectly correspond with the high risk aversion of the Japanese society. Hofstede explains the high risk aversion of Japanese by the threat of natural disasters such as earthquakes or tsunamis. Japanese people had to learn to prepare themselves for any uncertain situation.
When it comes to the other variables we analyzed, we found numerical evidence that a part-time job does not hamper the quality of life. The opposite seems to be true; the better income asserts a positive impact on the quality of life. With regard to the length of study, we found some numerical evidence that the quality of life decreases with the number of years studied and the closer students get to graduation. In line with our expectations, we discovered that living with parents does decrease the quality of life, while studying more than one subject increases the quality of life. The latter result is somewhat contrary to expectations as we have expected a higher stress level of dual degree students. The major limitation of our study is clearly the small sample size. Due to our small sample size, most observations do have a rather explanatory character and future research should validate our findings in a confirmatory study design using a broader sample. On the other hand, a sample size of 31 is not as small as one is inclined to believe; Schwappach and Boluarte found in their survey of 18 German studies that elicited utilities for health economic evaluations that the majority of the papers worked with sample sizes in the range of 20–40 respondents.52 Another issue is the generalizability of the results since our sample is very homogeneous and probably not representative for the general population.
Conclusion
Based on a small experiment we conclude that gender specific differences in risk attitudes lead to a systematic gender bias in eliciting utilities. Health care planners should be aware of this bias when making allocation decisions.
Disclosure
JM is employed at Janssen KK, LAO has no conflict of interest.
References
von Neumann J, Morgenstern O. Theory of Games and Economic Behavior (Commemorative Edition). Princeton University Press; 2007. | |
Sharma S, Brown GC, Brown MM, et al. Converting visual acuity to utilities. Can J Ophthalmol. 2000;35(5):267–272. | |
Brazier J, Roberts J, Deverill M. The estimation of a preference-based measure of health from the SF-36. J Health Econ. 2002;21(2):271–292. | |
Bagust A, Beale S. Modelling EuroQol health-related utility values for diabetic complications from CODE-2 data. Health Econ. 2005;14(3):217–230. | |
Gafni A. The standard gamble method: what is being measured and how it is interpreted. Health Serv Res. 1994;29(2):207–224. | |
Osch SMC van, Wakker PP, Hout WB van den, Stiggelbout AM. Correcting biases in standard gamble and time tradeoff utilities. Med Decis Making. 2004;24(5):511–517. | |
Rosen AB, Tsai JS, Downs SM. Variations in risk attitude across race, gender, and education. Med Decis Making. 2003;23(6):511–517. | |
Kurth RA, Klier S, Pokorny D, Jurkat HB, Reimer C. Studienbezogene Belastungen, Lebensqualität und Beziehungserleben bei Medizinstudenten [Study Related Stress, and Quality of Life among German Medical Students]. Psychotherapeut. 2007;52(5):355–361. German. | |
Sokratous S, Merkouris A, Middleton N, Karanikola M. The prevalence and socio-demographic correlates of depressive symptoms among Cypriot university students: a cross-sectional descriptive co-relational study. BMC Psychiatry. 2014;14:235. | |
Bhandari P. Stress and health related quality of life of Nepalese students studying in South Korea: a cross sectional study. Health Qual Life Outcomes. 2012;13;10:26. | |
Jurkat H, Höfer S, Richter L, Cramer M, Vetter A. [Quality of life, stress management and health promotion in medical and dental students]. A comparative study. Dtsch Med Wochenschr. 2011;136(23):1245–50. German. | |
Unger M, Dünser L, Fessler A, et al. Bericht zur sozialen Lage der Studierenden 2011 – Institute for Advanced Studies. Available from: http://www.sozialerhebung.at/Ergebnisse. Accessed March 29, 2015. | |
Paro HB, Morales NM, Silva CH, et al. Health-related quality of life of medical students. Med Educ. 2010;44(3):227–235. | |
Burisch M. Das Burnout-Syndrom: Theorie der inneren Erschöpfung [The burnout Syndrome: Theory of emotional exhaustion]. Springer; 2006. German. | |
Russ TC, Stamatakis E, Hamer M, Starr JM, Kivimäki M, Batty GD. Association between psychological distress and mortality: individual participant pooled analysis of 10 prospective cohort studies. BMJ. 2012;345:e4933. | |
Nyberg ST, Fransson EI, Heikkilä K, et al. Job strain as a risk factor for type 2 diabetes: a pooled analysis of 124,808 men and women. Diabetes Care. 2014;37(8):2268–2275. | |
Heikkilä K, Nyberg ST, Fransson EI, et al. Job strain and tobacco smoking: an individual-participant data meta-analysis of 166 130 adults in 15 European studies. PLoS One. 2012;7(7):e35463. | |
Kieschnick R, McCullough BD. Regression analysis of variates observed on (0, 1): percentages, proportions and fractions. Statistical Modelling. 2003;3(3):193–213. | |
Papke LE, Wooldridge JM. Econometric methods for fractional response variables with an application to 401(k) plan participation rates. J Appl Econ. 1996;11(6):619–632. | |
Baum CF. Stata tip 63: Modeling proportions. Stata Journal. 2008;8(2):299–303. | |
Ferrari S, Cribari-Neto F. Beta regression for modelling rates and proportions. Journal of Applied Statistics. 2004;31(7):799–815. | |
Basu A, Manca A. Regression estimators for generic health-related quality of life and quality-adjusted life years. Med Decis Making. 2012, 32(1):56–69. | |
Richardsen AM, Burke RJ. Occupational stress and job satisfaction among physicians: Sex differences. Soc Sci Med. 1991;33(10):1179–1187. | |
Khan HTA, Raeside R. Between country variations in self-rated-health and associations with the quality of life of older people: evidence from the global ageing survey. Applied Research Quality Life. 2013;9(4):923–949. | |
Xu X, Bao H, Strait K, et al. Sex differences in perceived stress and early recovery in young and middle-aged patients with acute myocardial infarction. Circulation. 2015;131(7):614–623. | |
Ross SE, Niebling BC, Heckert TM. Sources of stress among college students. College Student Journal. 1999;33(2):312. | |
Diener ED, Diener C. The wealth of nations revisited: Income and quality of life. Soc Indic Res. 1995;36(3):275–286. | |
Kahneman D, Deaton A. High income improves evaluation of life but not emotional well-being. Proc Natl Acad Sci U S A. 2010;107(38):16489–16493. | |
Tang TLP. Income and quality of life: does the love of money make a difference? J Bus Ethics. 2006;72(4):375–393. | |
Towbes LC, Cohen LH. Chronic stress in the lives of college students: Scale development and prospective prediction of distress. J Youth Adolescence. 1996;25(2):199–217. | |
D’Zurilla TJ, Sheedy CF. The relation between social problem-solving ability and subsequent level of academic competence in college students. Cogn Ther Res. 1992;16(5):589–599. | |
Meisenberg G, Woodley MA. Gender differences in subjective well-being and their relationships with gender equality. J Happiness Stud. 2014:1–17. | |
Dohmen T, Falk A, Huffman D, Sunde U, Schupp J, Wagner GG. Individual risk attitudes: measurement, determinants, and behavioral consequences. Journal of the European Economic Association. 2011; 9(3):522–550. | |
Eckel CC, Grossman PJ. Forecasting risk attitudes: An experimental study using actual and forecast gamble choices. Journal of Economic Behavior and Organization. 2008;68(1):1–17. | |
Hartog J, Ferrer-i-Carbonell A, Jonker N. Linking measured risk aversion to individual characteristics. Kyklos. 2002;55(1):3–26. | |
Holt CA, Laury SK. Risk aversion and incentive effects. American Economic Review. 2002;92(5):1644–1655. | |
Harbaugh WT, Krause K, Vesterlund L. Risk attitudes of children and adults: choices over small and large probability gains and losses. Experimental Economics. 2002;5(1):53–84. | |
Croson R, Gneezy U. Gender differences in preferences. Journal of Economic Literature. 2009;47(2):448–474. | |
Golsteyn B, Heckman J, Meijers H. Gender differences in risk aversion and ambiguity aversion. Journal of the European Economic Association. 2009;7(2–3):649–658. | |
Khodarahimi S. Sensation-seeking and risk-taking behaviors: a study on young Iranian adults. Applied Research Quality Life. 2014:1–14. | |
Bayyurt N, Karişik V, Coşkun A. Gender differences in investment preferences. European Journal of Economic and Political Studies. 2013;6(1):71–83. | |
Barber BM, Odean T. Boys will be boys: gender, overconfidence, and common stock investment. Quarterly Journal of Economics. 2001;116(1):261–292. | |
van Osch SM, Stiggelbout AM. The construction of standard gamble utilities. Health Econ. 2008;17(1):31–40. | |
Risberg G, Johansson EE, Hamberg K. A theoretical model for analysing gender bias in medicine. International Journal for Equity in Health. 2009;8(1):28. | |
Jones AS, Frick KD. Gender bias in economic evaluation methods: time costs and productivity loss. Womens Health Issues. 2008;18(1):1–3. | |
Papke L. How are participants investing their accounts in participant directed individual account pension plans? American Economic Review. 1998;88(2):212–216. | |
Warshawsky-Livne L, Novack L, Rosen AB, Downs SM, Shkolnik-Inbar J, Pliskin JS. Gender differences in risk attitudes. Adv Health Econ Health Serv Res. 2014;24:123–40. | |
Dohmen T, Falk A, Huffman D, Sunde U. Are risk aversion and impatience related to cognitive ability? American Economic Review. 2010;100(3):1238–60. | |
Thavorncharoensap M, Teerawattananon Y, Natanant S, Kulpeng W, Yothasamut J, Werayingyong P. Estimating the willingness to pay for a quality-adjusted life year in Thailand: does the context of health gain matter? Clinicoecon Outcomes Res. 2013;5:29–36. | |
Norman R, Cronin P, Viney R, King M, Street D, Ratcliffe J. International comparisons in valuing EQ-5D health states: a review and analysis. Value Health. 2009;12(8):1194–1200. | |
Hofstede G, Hofstede GJ, Minkov M. Cultures and Organizations: Software of the Mind. 3rd ed. New York: McGraw-Hill; 2010. | |
Schwappach DL, Boluarte T. Wie werden in deutschen Studien qualitätsadjustierte Lebensjahre definiert? Ein systematischer Review deutscher Kosten-Nutzwert-Analysen [How are quality adjusted life years defined in Germany? a systematic review of German economic evaluations of health care]. Dtsch Med Wochenschr. 2006;37(131):2004–2009. German. |
 © 2015 The Author(s). This work is published and licensed by Dove Medical Press Limited. The full terms of this license are available at https://www.dovepress.com/terms.php and incorporate the Creative Commons Attribution - Non Commercial (unported, v3.0) License.
By accessing the work you hereby accept the Terms. Non-commercial uses of the work are permitted without any further permission from Dove Medical Press Limited, provided the work is properly attributed. For permission for commercial use of this work, please see paragraphs 4.2 and 5 of our Terms.
© 2015 The Author(s). This work is published and licensed by Dove Medical Press Limited. The full terms of this license are available at https://www.dovepress.com/terms.php and incorporate the Creative Commons Attribution - Non Commercial (unported, v3.0) License.
By accessing the work you hereby accept the Terms. Non-commercial uses of the work are permitted without any further permission from Dove Medical Press Limited, provided the work is properly attributed. For permission for commercial use of this work, please see paragraphs 4.2 and 5 of our Terms.